
The Case
The coffee on your desk is already cold. As the newest Asset Manager at Metro Power & Light, you’ve spent your first two weeks buried in orientation manuals and safety protocols. This morning, that changed. An urgent meeting request from your director, Maria, appeared on your calendar, followed by a cryptic data file. The subject: "Transformer Failures - Urgent."
Metro Power is facing a growing crisis. Over the past 18 months, a series of distribution transformer failures have plagued the city's older neighborhoods. What started as minor, isolated incidents has escalated into a pattern of disruptive blackouts. Customer complaints are flooding the call center, and city regulators are starting to ask pointed questions. The pressure is mounting.
The problem lies in the company's deeply ingrained "run-to-failure" maintenance philosophy, championed by Frank Miller, the formidable VP of Operations. Frank, a 30-year veteran of the company, sees the recent failures as a statistical anomaly—a "bad batch" of equipment that will eventually work itself out. He believes that replacing transformers only after they fail is the most cost-effective approach, a strategy that has worked for decades. He's openly skeptical of what he calls "fancy data-mining expeditions."
Maria, your director, thinks differently. She sees a dangerous trend and believes a proactive, data-driven approach is the only way to prevent a catastrophic, city-wide failure. She has given you a small window of opportunity to prove it. You have the initial failure data, a few internal documents, and one week to prepare for a meeting with her and Frank. You don't need to have the final answer, but you must come to that meeting with a compelling analysis of the situation and a clear proposal for how data analytics can guide their next steps. This is your chance to show the value of modern asset management and convince Frank that looking at the data isn't a waste of time—it's the only way to stop the ticking clock.
Resources and Data
You have been given access to a preliminary set of files to begin your analysis. Review them carefully to understand the scope of the problem.
Key Document: Email: The Transformer Problem
Transformer Failure Records (Last 24 Months)
| Transformer ID | Installation Date | Failure Date | Manufacturer | Model Number | Location Zip Code | Last Maintenance Date | Failure Type | Load at Failure kVA |
|---|---|---|---|---|---|---|---|---|
| MPL-TRN-843012 | 2018-05-10 | 2023-07-22 | VoltaTech | VT-250 | 10021 | 2020-02-15 | Winding Fault | 245 |
| MPL-TRN-112984 | 2005-11-20 | 2024-01-15 | Global Electric | GE-500 | 10036 | 2019-08-01 | Cooling System Malfunction | 480 |
| MPL-TRN-843115 | 2019-02-01 | 2023-11-05 | VoltaTech | VT-250 | 10022 | 2021-01-20 | Winding Fault | 260 |
| MPL-TRN-335109 | 2010-08-15 | 2022-09-30 | PowerGrid Inc. | PG-X1 | 10021 | 2018-06-11 | Bushing Failure | 145 |
| MPL-TRN-842055 | 2017-09-25 | 2023-03-12 | VoltaTech | VT-250 | 10022 | 2019-11-03 | Overload | 275 |
| MPL-TRN-113588 | 2008-03-14 | 2023-08-20 | Global Electric | GE-100 | 10128 | 2017-05-19 | Bushing Failure | 95 |
| MPL-TRN-841998 | 2016-11-30 | 2022-05-18 | VoltaTech | VT-150 | 10021 | 2018-10-01 | Winding Fault | 140 |
| MPL-TRN-336040 | 2012-07-07 | 2024-02-01 | PowerGrid Inc. | PG-X5 | 10028 | 2020-04-22 | Cooling System Malfunction | 450 |
| MPL-TRN-843501 | 2019-08-11 | 2024-03-29 | VoltaTech | VT-250 | 10021 | 2021-07-14 | Winding Fault | 255 |
| MPL-TRN-112876 | 2004-01-22 | 2022-12-10 | Global Electric | GE-500 | 10022 | 2015-02-28 | Overload | 520 |
| MPL-TRN-842888 | 2018-10-05 | 2023-09-01 | VoltaTech | VT-250 | 10024 | 2020-09-09 | Bushing Failure | 230 |
| MPL-TRN-335291 | 2011-04-19 | 2023-06-05 | PowerGrid Inc. | PG-X1 | 10022 | 2019-03-15 | Overload | 160 |
| MPL-TRN-842533 | 2017-01-15 | 2022-08-25 | VoltaTech | VT-150 | 10021 | 2019-02-11 | Cooling System Malfunction | 148 |
| MPL-TRN-113990 | 2009-09-09 | 2023-10-14 | Global Electric | GE-100 | 10021 | 2018-07-30 | Bushing Failure | 105 |
| MPL-TRN-843819 | 2020-03-20 | 2024-05-11 | VoltaTech | VT-250 | 10022 | 2022-01-18 | Winding Fault | 265 |
📊 View Diagram: Current Maintenance Process: Run-to-Failure
Asset Health Index (AHI)
Your Task
You are the new Asset Manager. Your task is to analyze the provided resources and prepare for your upcoming meeting with Maria and Frank. You need to develop a preliminary analysis that demonstrates the value of a data-driven approach. Specifically, you must use the evidence to formulate a clear, concise argument that outlines the current situation and a path forward.
Your deliverable is a set of talking points for the meeting. You should be prepared to: 1. Summarize your initial findings from the transformer failure data. 2. Propose a set of Key Performance Indicators (KPIs) that Metro Power & Light should start tracking to monitor transformer health. 3. Formulate one key question for each type of analytics (descriptive, predictive, and prescriptive) that would help solve this problem.
How to Approach This Task
Structure your analysis by following these four steps:
- Define the Problem: What is the core business problem, beyond the technical one? Consider costs, reputation, and risk.
- Identify Core Issues: Based on the data, what are the primary drivers of the problem?
- Identify Possible Solutions: How can a data analytics approach address the core issues?
- Recommend a Path Forward: What specific, actionable steps should the company take next?
Guiding Questions
Use these questions to focus your analysis of the case materials and prepare your response.
- Looking at the
transformer-failure-data-q3file, are there any immediate patterns related to manufacturer, model, or age (installation date vs. failure date)? - What does the
run-to-failure-flowcharttell you about the efficiency and risks of the current maintenance strategy? - According to the email from Maria, what is the primary obstacle to changing the current strategy? How does this influence how you should present your findings?
- Based on the data, what are two or three potential Key Performance Indicators (KPIs) that would give a better view of transformer health than simply waiting for a failure?
- How does the concept of an
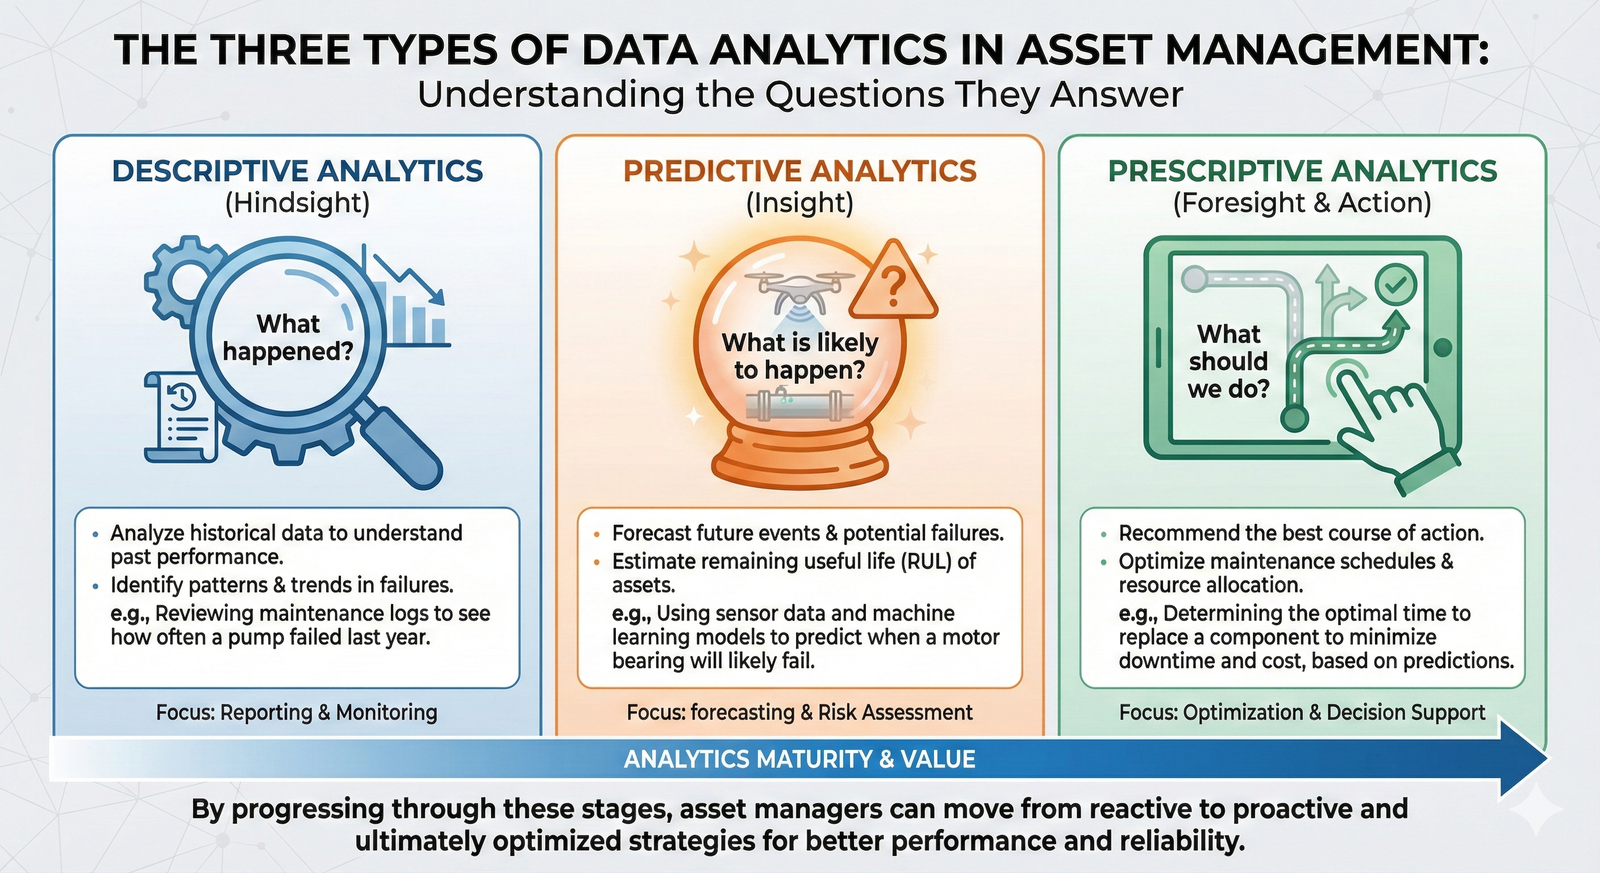
Asset Health Index (AHI)relate to the problems Metro Power is facing? - Formulate a descriptive analytics question that would help Frank Miller see the extent of the problem using the existing data. (Hint: Descriptive analytics answers "What happened?")
- Formulate a predictive analytics question that would show the value of a more proactive approach. (Hint: Predictive analytics answers "What could happen?")
- Formulate a prescriptive analytics question that would guide a future, data-driven replacement strategy. (Hint: Prescriptive analytics answers "What should we do?")
An Expert Response
A Sample Response
What follows is a sample expert response to the task. Your own analysis might have focused on different, equally valid points. Use this as a benchmark to compare against your own thinking, not as the only correct answer.
Here are the talking points I would prepare for the meeting with Maria and Frank.
Subject: Preliminary Analysis of Transformer Failures & Proposed Path Forward
1. Initial Findings (The Problem is in the Data)
My analysis of the failure data from the last 24 months shows a clear and concerning trend, not a random "bad batch." * Manufacturer Disparity: Transformers manufactured by VoltaTech, specifically the VT-250 model, account for over 60% of all failures despite representing only 25% of our total transformer inventory in the affected areas. * Premature Failure: The average time-to-failure for a VoltaTech VT-250 is 4.8 years, whereas competitors' models are lasting, on average, 11.2 years. * Geographic Clustering: The failures are heavily concentrated in older, more densely populated zip codes, suggesting that aging infrastructure combined with potentially higher loads is a contributing factor that our current model ignores.
The current "run-to-failure" process is no longer financially or reputationally sustainable. It guarantees that we are always one step behind, incurring high emergency-dispatch costs and angering our customers.
2. Proposed Key Performance Indicators (How We Should Measure Health)
To move from a reactive to a proactive strategy, we need to start tracking the right metrics. I propose we begin monitoring: * Mean Time Between Failures (MTBF) by Model/Manufacturer: This will allow us to quantify the reliability of assets from different suppliers. * Asset Age vs. Failure Rate: To establish a clear picture of the lifecycle of our assets and identify the point where failure risk begins to accelerate. * Percentage of Assets Under High Load: Tracking which transformers are consistently operating near their maximum capacity to identify high-risk units.
These KPIs will form the foundation of a future Asset Health Index (AHI) for our entire transformer fleet.
3. Key Questions to Guide Our Analytics Strategy
To solve this, we need to ask better questions. I propose a phased analytics approach, starting with the most straightforward questions and building from there.
- Descriptive Question (What happened?): "What is the historical failure rate and total cost of failure (including replacement, labor, and estimated outage impact) for each transformer model in our network over the last five years?" This will give us a clear, financially-grounded picture of the problem's scale.
- Predictive Question (What could happen?): "Based on age, model, location, and historical load data, which 100 transformers across our entire network have the highest probability of failing in the next 18 months?" This allows us to move from reacting to planning.
- Prescriptive Question (What should we do?): "Given a maintenance budget of $2 million, which specific set of transformer replacements and repairs will give us the largest possible reduction in unplanned service interruptions over the next fiscal year?" This is the ultimate goal—using data to optimize our capital investment for maximum reliability.
Assess Yourself
Evaluate Your Work
Review your own response to the task. Use the following criteria to assess the strengths and weaknesses of your analysis. Consider how you could improve your response based on these benchmarks.
- Problem Framing: Did you accurately define the problem in business terms (cost, risk, reputation) rather than just technical terms ("transformers are failing")?
- Data Interpretation: Did you identify the specific, actionable trend in the data (e.g., the poor performance of the VoltaTech VT-250 model)?
- KPI Relevance: Are your proposed KPIs specific, measurable, and directly related to improving asset reliability and preventing future failures?
- Application of Analytics: Did you correctly formulate a distinct question for each of the three types of analytics (descriptive, predictive, prescriptive)?
- Strategic Recommendation: Does your proposed path forward clearly show a shift from a reactive to a proactive asset management strategy?
- Audience Awareness: Is your argument framed in a way that would be clear and compelling to both a supportive director (Maria) and a skeptical VP (Frank)?
Learning Progress
By working through the Metro Power & Light case, you have practiced applying data analytics to a critical asset management decision. You've identified relevant KPIs for monitoring equipment reliability and formulated the kinds of descriptive, predictive, and prescriptive questions that drive a modern, data-informed strategy.
Next Steps
Excellent work analyzing this complex scenario. You've successfully applied key data concepts to a realistic professional challenge. When you are ready, please navigate back to the main course page to continue your learning journey.
