
Introduction
For decades, managing large-scale physical assets was a craft honed by experience. A seasoned plant manager could walk a facility floor and, by the sound of a pump or the hum of a transformer, get a sense of its health. Decisions about maintenance, repair, or replacement were often guided by well-worn rules of thumb, historical precedent, and a healthy dose of professional intuition. This approach served us well, but it has its limits. In a world of increasing complexity, tighter budgets, and higher performance expectations, "gut feel" is no longer enough.
We are now in the midst of a fundamental shift—a move from reactive, experience-based practices to proactive, evidence-based strategies. The catalyst for this transformation is data. The same pumps, pipes, bridges, and buildings we've always managed are now capable of telling us their stories in real-time. This article is your guide to understanding this new landscape. We will explore how harnessing asset data is not just a technical exercise but a strategic imperative that is redefining what it means to be an effective asset manager. You will learn how to move beyond the spreadsheet and leverage data to make smarter, faster, and more defensible decisions that create tangible value for your organization.
The Old Way vs. The New Way: A Tale of Two Pumps
Imagine a critical water pump at a municipal treatment facility. In the traditional model, its maintenance schedule is based on the manufacturer's recommendation: "service every 2,000 hours." This is a static, one-size-fits-all approach. The maintenance team performs the service, whether the pump needs it or not. One day, 500 hours after a scheduled service, the pump fails catastrophically. The post-mortem reveals a bearing failure that wasn't due for inspection for another 1,500 hours. The result is costly emergency repairs, service disruption, and a team left wondering what they could have done differently.
Now, let's rewind and equip that same pump with modern sensors measuring vibration, temperature, and power consumption. This stream of data feeds into an asset management system. Instead of relying on a generic schedule, the system analyzes the pump's actual operating conditions. This is the foundation of Data-Driven Decision Making. The system detects a subtle but steady increase in vibration signatures, a pattern previously correlated with bearing wear. It automatically generates a work order to inspect the bearing, not in 1,500 hours, but next week. The team replaces the worn bearing during a planned, low-cost maintenance window, preventing the failure entirely. Service is uninterrupted, costs are controlled, and reliability is enhanced. This is the power of data in action.
The Foundation: High-Quality Asset Data
The story of the two pumps highlights a simple truth: the quality of your decisions is capped by the quality of your information. To make this new approach work, you need a solid foundation of Asset Data. This isn't just one type of information; it's a rich tapestry woven from multiple sources:
- Static Data: The asset's "birth certificate." This includes design specifications, manufacturer, installation date, material composition, and its location in a GIS system.
- Operational Data: How the asset is performing right now. This is often collected by sensors and control systems (SCADA). Think of flow rates, pressure, temperature, cycle counts, and energy consumption.
- Condition Data: The asset's "health record." This comes from inspections, non-destructive testing, vibration analysis, thermal imaging, and other diagnostic techniques.
- Maintenance Data: The asset's "service history." This includes records of all planned and unplanned work, parts used, labor hours, and costs incurred.

However, simply having this data is not enough. It must be trustworthy. This brings us to the critical concept of Data Quality. You've likely heard the phrase "garbage in, garbage out." In asset management, poor data quality doesn't just lead to bad reports; it leads to bad decisions, wasted resources, and increased risk. A maintenance record with the wrong date, a sensor that's out of calibration, or an asset registry with missing entries can all undermine your efforts.
The Five Dimensions of Data Quality
When evaluating your asset data, think about these five key characteristics:
- Accuracy: Does the data correctly reflect the real-world object or event? (Is the recorded pressure the actual pressure?)
- Completeness: Are all the necessary data points present? (Is the 'failure code' field filled in for every repair?)
- Consistency: Is the data uniform across different systems and records? (Is 'Pump 7' identified the same way in the maintenance system and the financial system?)
- Timeliness: Is the data available when it's needed to make a decision? (Are sensor readings from yesterday useful for preventing a failure today?)
- Validity: Does the data conform to the defined format and rules? (Is the installation date in a 'YYYY-MM-DD' format as required?)
To see the difference this makes, consider a simple maintenance log.
Table 1: Maintenance Log Data Quality Comparison
| Record ID | Asset ID | Service Date | Action Taken | Failure Code | Data Quality Issue |
|---|---|---|---|---|---|
| 1001 | pmp-007 | Last Tuesday | fixed pump | None | Invalid 'Service Date' format; Vague 'Action Taken' description; Missing 'Failure Code'; Inconsistent 'Asset ID' capitalization. |
| 1002 | Pump 7 | 2023-05-20 | Service | BROKE | Inconsistent 'Asset ID' format; Vague 'Action Taken' description; Non-standard 'Failure Code'. |
| 1003 | PMP-007 | 07/18/2023 | Replaced worn part | Inconsistent 'Service Date' format; Vague 'Action Taken' description; Missing 'Failure Code'. | |
| 2001 | PMP-007 | 2023-10-05 | Replaced impeller bearing, part #789-B. | BRG-FL-01 | None |
| 2002 | PMP-007 | 2023-11-12 | Cleaned and recalibrated primary flow sensor, model #SENS-F4. | CAL-DRIFT-03 | None |
| 2003 | PMP-007 | 2023-12-01 | Replaced worn gasket on primary housing, part #GSK-44C. | SEAL-FAIL-02 | None |
The "Poor Quality" records are almost useless for analysis. You can't reliably track the history of "PMP-007," you don't know the specific reasons for failure, and you can't automate any processes based on this data. The "Good Quality" records, on the other hand, are a goldmine. They provide a clear, consistent, and complete history that can be used to identify trends, calculate reliability metrics, and predict future problems.
Turning Data into Insight: Asset Management Analytics
Once you have a foundation of high-quality data, you can begin the real work: turning that raw data into actionable intelligence. This is the domain of Asset Management Analytics. Analytics isn't a single activity but a spectrum of capabilities, each answering a more complex question than the last.
📊 View Diagram: The Spectrum of Asset Management Analytics
-
Descriptive Analytics: This is the starting point. It answers the question, "What happened?" This involves creating dashboards and reports that summarize historical data. For example, a report showing the number of failures per asset class last quarter, or a dashboard visualizing the maintenance backlog. It provides visibility but doesn't explain the 'why'.
-
Diagnostic Analytics: This digs deeper to answer, "Why did it happen?" Here, you might correlate the failure data with operational data. Did the pumps that failed all operate at a higher-than-average temperature? Did the failures occur after a specific software update? This is about root cause analysis.
-
Predictive Analytics: This is where things get exciting. It uses statistical models and machine learning to answer, "What will happen?" By analyzing historical data, a predictive model can forecast the probability of an asset failing within a specific future timeframe. This is the technology behind the "smart pump" example, enabling a shift from preventive to predictive maintenance.
-
Prescriptive Analytics: This is the most advanced form, answering, "What should we do?" It goes beyond predicting a failure and recommends a specific course of action to optimize for a desired outcome (like minimizing cost or maximizing uptime). A prescriptive model might not just say "the pump will fail," but "the optimal action is to replace the impeller in 25 days, which balances the cost of early replacement against the risk of failure."
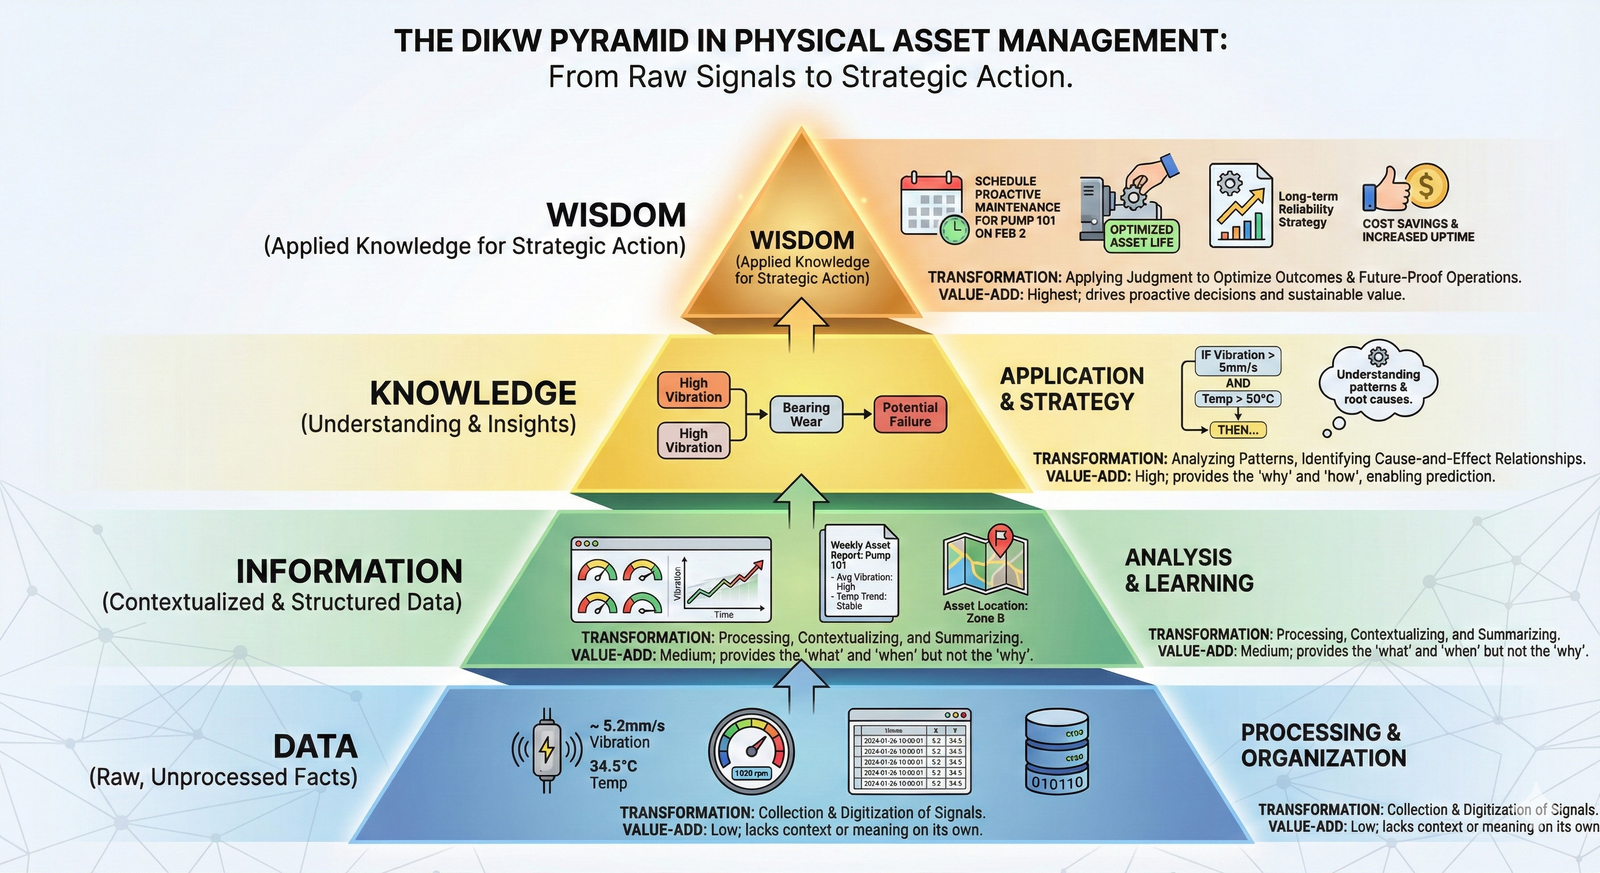
This progression from raw data to a recommended action is often called the "data-to-wisdom" journey.
The Guiding Framework: ISO 55000
With all this data and analytical power, how do you ensure it's being used effectively and aligned with the organization's goals? A data-driven free-for-all is no better than the old gut-feel approach. You need a strategic framework. For modern asset management, that framework is the ISO 55000 family of standards.
It's a common misconception that ISO 55000 is a prescriptive rulebook that tells you exactly how to manage your assets. It's not. Instead, it provides a structure for asking the right questions and ensuring your asset management activities are purposeful. It's built on the "Plan-Do-Check-Act" cycle, a cornerstone of continuous improvement.
- Plan: Define your asset management objectives. What does "value" mean for your organization? Is it maximizing production, ensuring public safety, or minimizing lifecycle costs? Your data strategy must be designed to measure performance against these objectives.
- Do: Implement the plan. This is where you execute your data collection, analytics, and maintenance strategies.
- Check: Monitor and measure performance. This is where your analytics come in. Are you meeting your objectives? Is your asset performance improving? Data provides the objective evidence needed for this step.
- Act: Take action to improve. Based on your analysis, where are the gaps? What processes need to be changed? This closes the loop, ensuring the organization is constantly learning and adapting.
ISO 55000 and the 'Line of Sight'
A core principle of ISO 55000 is establishing a clear 'line of sight' from your organization's high-level strategic goals down to the day-to-day activities of an individual technician working on a specific asset. Data and analytics are the connective tissue that makes this line of sight visible and manageable. You can use data to demonstrate exactly how replacing a specific bearing contributes to the corporate objective of improving overall plant reliability by 5%.
Historically, standards like ISO 55000 emerged from a growing recognition that catastrophic failures (like the Piper Alpha oil platform disaster or the Longford gas plant explosion) were often failures of management systems, not just technical components. These events drove the industry toward a more holistic, risk-based, and systematic approach, for which data is the essential fuel.
The Future is Now: Digital Twins and AI
The principles we've discussed are not science fiction; they are being implemented today. And the technology continues to evolve. The convergence of the Internet of Things (IoT), cloud computing, and Artificial Intelligence (AI) is pushing the boundaries even further.
One of the most powerful emerging concepts is the Digital Twin. This is a virtual, dynamic model of a physical asset or system. It's not just a 3D drawing; it's a living simulation that is continuously updated with real-world data from its physical counterpart. An engineer can use a digital twin to simulate the impact of different operating scenarios, test a repair procedure before doing it in the field, or watch the virtual model degrade in parallel with the real asset, providing an unparalleled view of its health and performance.

This data-rich environment is the perfect playground for AI and machine learning algorithms, which can identify patterns far too complex for humans to see, leading to even more accurate predictions and optimized operational recommendations. This is the future you are stepping into—a profession where your expertise is augmented by powerful data tools, allowing you to manage assets with a level of precision and foresight that was unimaginable just a generation ago.
Closing
We've journeyed from the world of reactive, experience-based asset management to the frontier of proactive, data-driven strategies. The transition is not merely about adopting new software or installing more sensors. It's a fundamental change in mindset. It's about cultivating a culture of inquiry, where decisions are backed by evidence and where every asset's story is captured in data, waiting to be told.
You've seen how high-quality Asset Data is the bedrock of this new approach and how poor Data Quality can undermine the most sophisticated systems. By applying Asset Management Analytics, you can transform this data from a passive record into a predictive tool, enabling true Data-Driven Decision Making. Frameworks like ISO 55000 provide the strategic guardrails, ensuring your efforts are always aligned with creating value. As you move forward in your career, your ability to speak the language of data will be as important as your technical knowledge of the assets themselves.
Learning Outcomes
In this reading, you have explored the central role of data in modernizing asset management. You can now:
- Explain how moving from intuition-based methods to data-driven decision-making transforms asset management from a reactive to a proactive discipline, improving reliability and optimizing costs.
- Describe the critical relationship between comprehensive asset data, the dimensions of data quality, and the application of analytics to turn raw numbers into actionable insights.
- Recognize how the ISO 55000 standard provides a strategic management framework, using data to create a clear "line of sight" between organizational objectives and day-to-day asset activities.
You are also now familiar with the foundational concepts of Asset Management Analytics, Data-Driven Decision Making, Asset Data, Data Quality, and the ISO 55000 framework.
Assess Yourself
❓ Knowledge Check
Test your understanding of the key concepts from this section.
Next Steps
You have successfully completed this reading on the role of data in modern asset management. You've taken a significant step in understanding the future of this profession. Please navigate back to the course to continue your learning journey.
