
Introduction
If you're managing physical assets, you're sitting on a mountain of data. Every work order, sensor reading, and inspection report is a piece of a much larger puzzle. For decades, our job was to collect and report on this data—to look in the rearview mirror and describe what had already happened. But the world has changed. The expectation now is not just to report on the past, but to anticipate the future and, even better, to shape it.
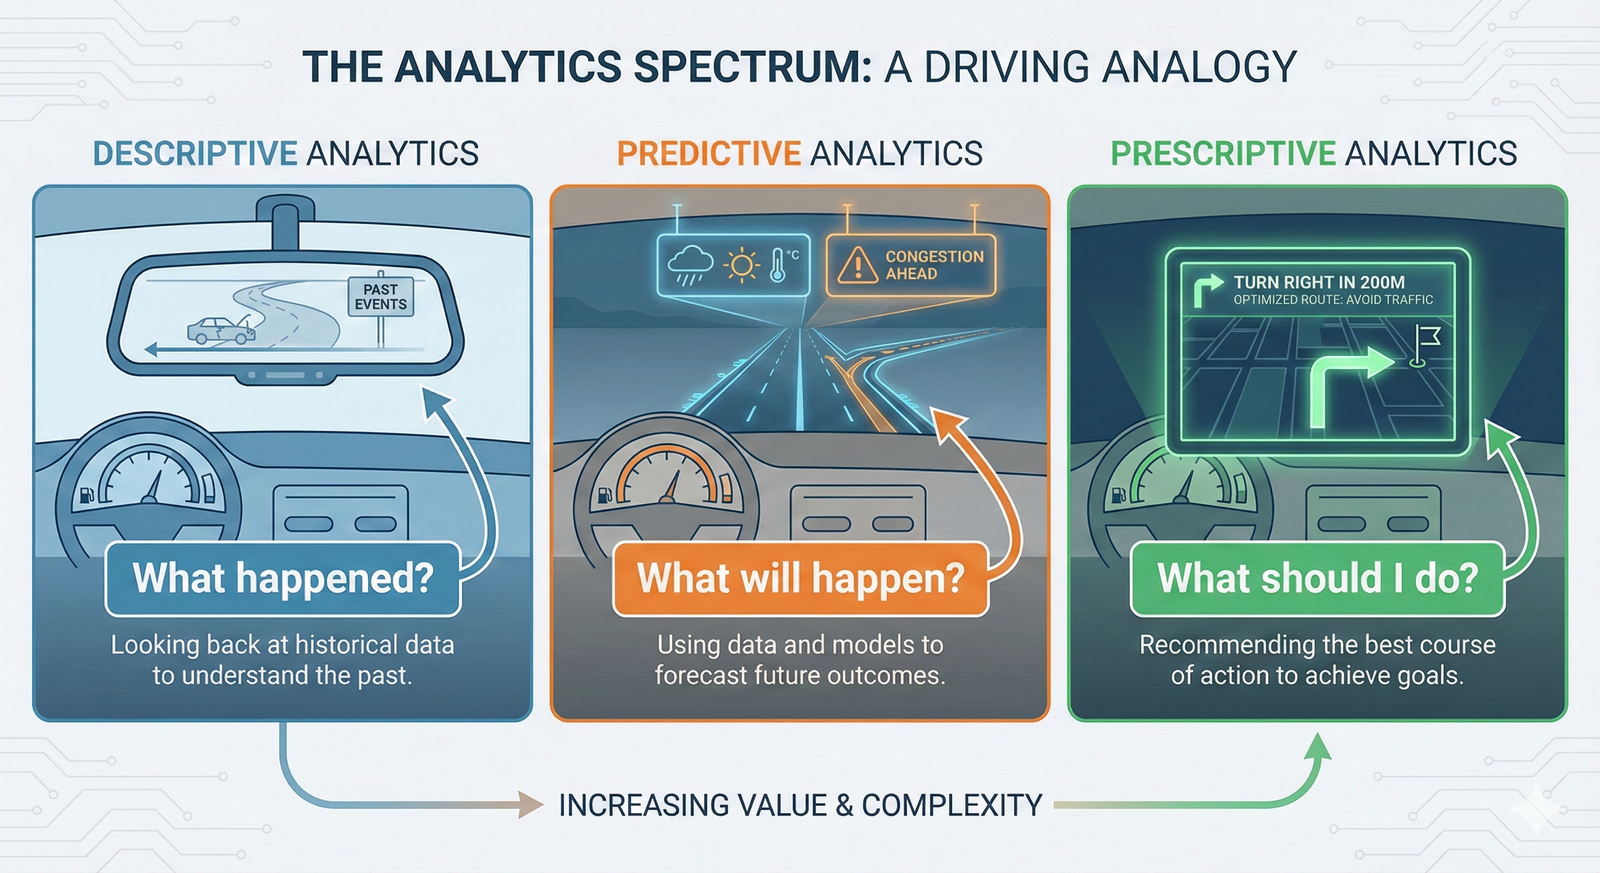
This is where the spectrum of analytics comes in. It's a framework that helps you transform raw data into your most powerful strategic tool. Think of it as a journey. You'll start by understanding what happened, then use that knowledge to predict what will likely happen next, and finally, reach the point where you can determine the best course of action to take. This progression from hindsight to foresight is what separates a good asset manager from a great one. In this reading, we'll walk through each stage of the analytics spectrum, using real-world examples to show you how to move from being reactive to truly proactive in managing your assets.
The Foundation: Descriptive Analytics - What Happened?
The starting point for any data-driven strategy is understanding your current reality. This is the domain of Descriptive Analytics. It involves taking the raw data from your assets and operations and turning it into something understandable. You're not predicting the future yet; you're creating a clear, accurate picture of the past.
Imagine you're the asset manager for a municipal water utility. You're responsible for hundreds of miles of pipes, dozens of pumping stations, and a treatment plant. Your computerized maintenance management system (CMMS) is filled with data: work orders for pipe repairs, energy consumption logs from pumps, and water quality test results.
Descriptive analytics is what allows you to answer questions like: * How many main breaks did we have last year? * What was our average pump maintenance cost per station? * Which neighborhoods experienced the most service disruptions?
The primary tool for this is Data Visualization. Instead of looking at thousands of rows in a spreadsheet, you create dashboards with charts and graphs. A bar chart might show the number of repairs by month, a map could highlight leak hotspots, and a pie chart could break down the types of failures.
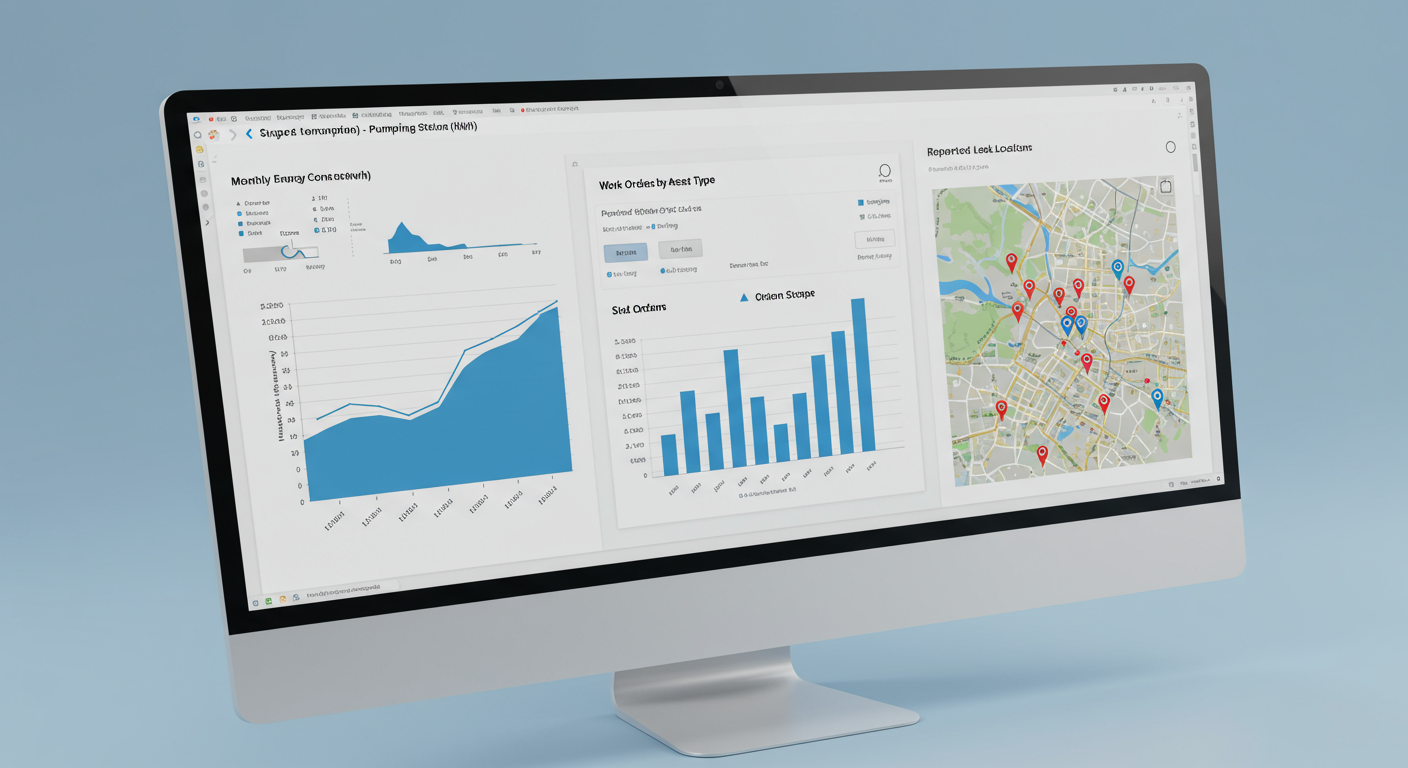
While a dashboard tells you what happened, it doesn't always tell you why. A more advanced form of descriptive analytics is Root Cause Analysis. If your dashboard shows that Pump Station 5 has abnormally high energy consumption, you don't just note it. You dig deeper. You analyze maintenance logs, operational parameters, and component histories to discover the root cause—perhaps a specific type of impeller wears out prematurely when dealing with water from a particular source. This is still descriptive work, but it's a critical bridge to the next stage of analytics.
The Value of a Solid Foundation
Never underestimate the power of descriptive analytics. Without a clean, accurate, and well-understood history of your assets, any attempt at prediction is just a guess. The quality of your predictive and prescriptive efforts is directly dependent on the quality of your descriptive data foundation.
To get a feel for the kind of data you'd be working with, here is a simplified sample of maintenance data for a fleet of service vehicles.
Sample Maintenance Log - Q3
| Vehicle ID | Service Date | Odometer Reading | Maintenance Type | Repair Category | Cost |
|---|---|---|---|---|---|
| UT-101 | 2022-03-15 | 45210 | Preventive | General Maintenance | 250.75 |
| UT-102 | 2022-04-02 | 88900 | Corrective | Engine | 2800.0 |
| UT-205 | 2022-05-18 | 25115 | Preventive | Tires | 620.0 |
| UT-101 | 2022-09-20 | 58345 | Corrective | Brakes | 850.0 |
| UT-102 | 2022-10-11 | 99500 | Preventive | General Maintenance | 310.4 |
| UT-208 | 2022-11-05 | 62050 | Corrective | Electrical | 480.75 |
| UT-205 | 2022-11-28 | 36800 | Preventive | Fluid Change | 185.5 |
| UT-102 | 2023-01-15 | 110200 | Corrective | Electrical | 625.0 |
| UT-101 | 2023-04-01 | 72100 | Preventive | Tires | 450.5 |
| UT-208 | 2023-05-19 | 74300 | Preventive | General Maintenance | 290.0 |
| UT-205 | 2023-06-02 | 49150 | Corrective | Hydraulics | 1575.25 |
| UT-102 | 2023-08-05 | 122450 | Preventive | Brakes | 380.9 |
| UT-101 | 2023-10-12 | 85400 | Corrective | Engine | 1890.6 |
| UT-208 | 2023-11-10 | 87900 | Corrective | Brakes | 975.2 |
| UT-205 | 2023-12-15 | 61300 | Preventive | General Maintenance | 275.0 |
Looking Ahead: Predictive Analytics - What Will Happen?
Once you have a firm grasp of what has happened, you can start looking to the future. This is the realm of Predictive Analytics. It builds directly on your descriptive data foundation to make educated and statistically-backed forecasts.
Let's return to the water utility. You've described the past: you know where and when pipes have failed. Now, you want to predict where they will fail next. Using predictive analytics, you can build a model that considers factors like pipe material, age, soil conditions, and historical pressure data. The model doesn't just say "old pipes fail more"; it can calculate a probability of failure for each individual segment of pipe in your network over the next 12 months.
This is a fundamental shift from reactive to proactive asset management. Instead of waiting for a call about a burst main flooding a street, you can identify the top 50 highest-risk pipe segments and schedule them for inspection or replacement as part of a planned capital project.
A core technique here is Forecasting. By analyzing the data from the vehicle maintenance log we saw earlier, you could forecast the number of brake-related repairs you'll need to perform next quarter, helping you manage your spare parts inventory and technician schedules more effectively.
The process involves feeding your historical data into a statistical or machine learning model, which then generates a prediction.
📊 View Diagram: The Predictive Analytics Process
Prediction is Not Certainty
Predictive models provide probabilities, not guarantees. A model might give a pipe segment an 80% chance of failure, but there's still a 20% chance it won't. The value lies in using these probabilities to focus your limited resources on the most likely problems, dramatically improving your efficiency.
The Final Frontier: Prescriptive Analytics - What Should We Do?
Knowing a failure is likely to happen is powerful. But what's the best way to respond? This is the most advanced and valuable stage of the analytics journey: Prescriptive Analytics.
Prescriptive analytics takes the forecast from the predictive model and recommends a specific course of action to achieve a specific goal. It's like having an expert advisor who has considered all the possibilities and can tell you the optimal path forward.
Consider our high-risk water pipe. * Descriptive: "This pipe segment has failed 3 times in 5 years." * Predictive: "This pipe segment has a 90% probability of failing this winter." * Prescriptive: "Given the 90% failure probability, the pipe's location under a major road, and the projected cost of an emergency repair ($150,000), we recommend replacing the 200-foot segment in the fall. This planned action will cost $90,000, avoiding the likely emergency and saving an estimated $60,000 while preventing a major traffic disruption."
To make these recommendations, prescriptive analytics relies on two key techniques: Optimization and Simulation. The system might simulate the outcomes of several different actions—"replace now," "re-line the pipe," "increase inspections," "do nothing"—and use optimization algorithms to identify the one that provides the best outcome based on your stated goals (e.g., minimizing total lifecycle cost).
This is where asset management becomes a true strategic function. You're no longer just fixing things; you're making optimized investment decisions that directly impact the financial health and service quality of your organization.
The Value Ladder: How the Analytics Spectrum Builds on Itself
It's essential to see these three types of analytics not as separate disciplines, but as sequential stages on a "ladder" of increasing value and complexity. Each step builds upon the one before it.
You cannot have meaningful predictions without accurate historical data. You cannot have optimized recommendations without a reliable forecast of what's likely to happen.
📊 View Diagram: The Analytics Value Pyramid
As you move up this pyramid, the competitive advantage and financial return grow exponentially. * Descriptive: Leads to cost savings through better reporting and understanding. * Predictive: Leads to higher efficiency and reliability by enabling proactive maintenance. * Prescriptive: Leads to optimized financial and operational performance by guiding the best possible investment and operational decisions.
The goal for any asset-intensive organization is to climb this ladder. It doesn't happen overnight. It requires a commitment to data quality, investment in the right tools, and the development of new skills within your team. But the journey is transformative, moving the asset management function from a cost center to a value-driving engine for the entire enterprise.
Closing
We've journeyed across the full spectrum of analytics, from the foundational work of descriptive analytics that tells us "what happened," to the forward-looking power of predictive analytics that forecasts "what will happen," and finally to the strategic advantage of prescriptive analytics that advises "what we should do." As we've seen with our water utility example, each stage builds upon the last, creating a ladder of increasing value. You can't simply jump to prescribing actions without first understanding the past and predicting the future.
Your role as an asset management professional is evolving. It's no longer enough to be a custodian of physical things; you must also be a steward of data. By mastering this spectrum, you can elevate your work from simple maintenance to strategic decision-making. You can help your organization allocate its resources more effectively, improve safety and reliability, and ultimately deliver better value to your stakeholders. This is the future of our profession, and it's a future driven by data.
Learning Outcomes
By completing this reading, you have taken a significant step toward mastering data-driven asset management. You can now: * Compare and contrast descriptive, predictive, and prescriptive analytics, using real-world asset management scenarios to articulate their distinct purposes and value. * Explain how these three types of analytics form a value ladder, where the insights from one stage provide the necessary foundation for the next. * Identify the key business and operational questions that each type of analytics is designed to answer, from understanding past performance to recommending future actions.
You are also now familiar with the essential concepts and techniques that underpin the analytics spectrum, including Data Visualization, Root Cause Analysis, Forecasting, Optimization, and Simulation.
Assess Yourself
Test your understanding of the analytics spectrum with this short quiz.
❓ Knowledge Check
Test your understanding of the key concepts from this section.
Next Steps
You have successfully completed this reading on the spectrum of analytics. This foundational knowledge will be critical as we move forward. Please navigate back to the course page to continue with the next activity.

