
The Skill
Identifying Key Performance Indicators (KPIs) is the process of selecting the vital metrics that measure how well your asset management strategy is performing against its objectives. This isn't just about collecting data; it's about choosing the right data that provides actionable insights.
Effective KPI selection allows you to track progress, diagnose problems, and make informed decisions to optimize asset performance, control costs, and maintain a safe working environment. This skill moves you from simply managing assets to strategically improving their value and contribution to the organization.
Why Is This Skill Important?
Without well-chosen KPIs, you are essentially managing critical infrastructure blind. You might be busy, but are you being effective? The right set of KPIs acts as a guidance system, telling you if you are on course to meet your goals for reliability, cost-efficiency, and safety.
In professional practice, KPIs are the language of performance. They allow you to communicate the health of your assets to stakeholders, justify budgets for improvements, and focus your team's efforts on activities that deliver measurable results. Mastering this skill ensures your decisions are data-driven, defensible, and directly aligned with organizational goals.
Your Task
You are an Asset Manager for a regional water utility. Your supervisor has sent you a memo outlining performance concerns at the Northwood Water Treatment Plant, which uses a series of aging pump systems.
Your task is to review the provided memo and propose a balanced set of Key Performance Indicators (KPIs) to monitor and improve the situation. Your proposal should include a mix of leading and lagging indicators that address the specific objectives mentioned in the memo.
Your Process
- Review the 'Northwood Plant Performance' memo in the Resources section.
- Identify the core asset management objectives (e.g., reliability, cost).
- Differentiate and select appropriate leading and lagging indicators.
- Propose a balanced set of KPIs to address the plant's challenges.
Resources and Data
Use the following internal memo to understand the context and challenges at the Northwood Water Treatment Plant. This document contains all the information you need to complete your task.
Key Document: Memo: Northwood Plant Performance
Detailed Steps
Follow these steps to build a robust and balanced set of KPIs for any asset management scenario.
Step 1: Define the Core Asset Management Objectives
Before you can measure performance, you must know what you are trying to achieve. Based on the memo, the objectives for the Northwood plant are clear: * Improve Reliability: Reduce unscheduled downtime and ensure the pumps can meet demand. * Control Costs: Bring maintenance spending back in line with the budget by reducing expensive emergency repairs. * Ensure Safety: Prevent injuries by creating a more controlled and predictable work environment.
Step 2: Differentiate Leading and Lagging Indicators
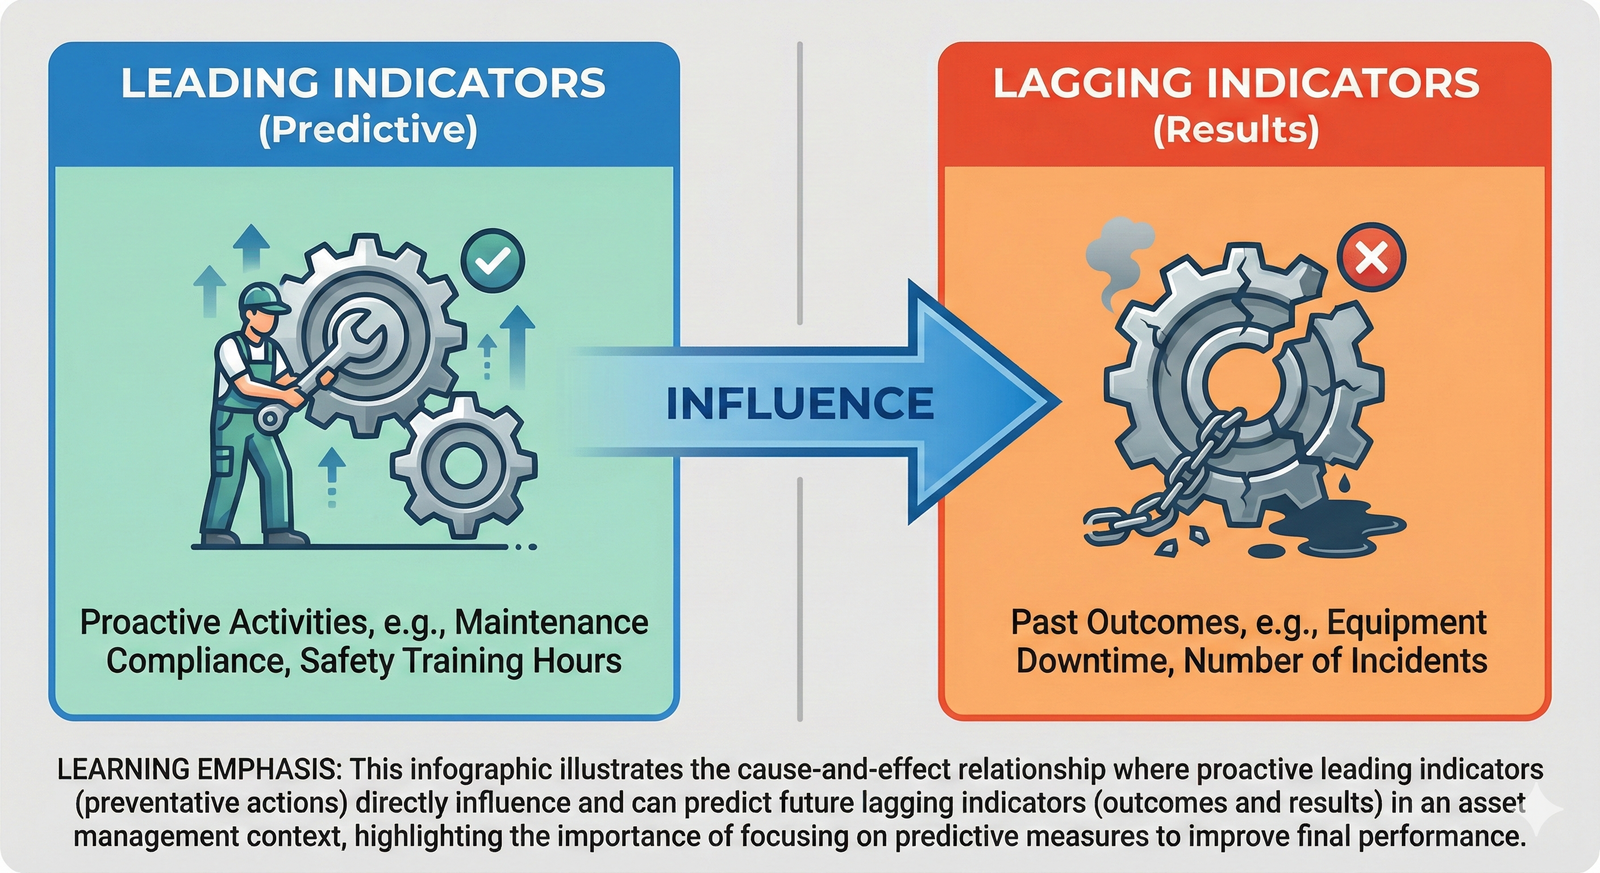
A balanced set of KPIs requires both leading and lagging indicators. They tell you different things: one predicts future performance, and the other shows what has already happened.
Leading Indicator
Lagging Indicator
This infographic shows the relationship between these two types of indicators. Leading indicators are the inputs you control, while lagging indicators are the results you get.
Step 3: Select KPIs for Each Objective
Now, select specific, measurable KPIs that align with the objectives and provide a mix of leading and lagging views.
For Reliability:
- Lagging:
Mean Time Between Failures (MTBF). This measures the average time a pump operates before it fails. An increasing MTBF is a clear sign of improving reliability. - Leading:
Preventive Maintenance (PM) Compliance. This measures the percentage of scheduled preventive maintenance tasks that are completed on time. A high PM compliance rate suggests future failures are less likely.
For Cost Control:
- Lagging:
Maintenance Cost as a % of Replacement Asset Value (RAV). This shows how much you're spending to maintain an asset relative to its worth. It's a high-level indicator of cost-effectiveness. - Leading:
Schedule Compliance. This measures the percentage of maintenance work that is completed as scheduled, rather than as a reactive, break-in task. Proactive, scheduled work is almost always cheaper than emergency work.
For Safety:
- Lagging:
Lost Time Injury Frequency Rate (LTIFR). This is a standard measure of the number of injuries that resulted in an employee being unable to work. The goal is always zero. - Leading:
Number of Near-Miss Reports. Encouraging and tracking near-miss reports helps you identify and fix hazards before they cause an actual injury. An increase in reporting (followed by corrective actions) is a positive leading indicator of a strong safety culture.
Step 4: Propose a Balanced Set
Avoid focusing on just one objective. For example, cutting all maintenance costs (a good cost KPI) would destroy reliability and eventually lead to higher costs and safety risks. A balanced approach ensures you are improving performance across all important areas.
📊 View Diagram: A Balanced KPI Approach
Your final proposal should present a concise list of these KPIs, clearly identifying them as leading or lagging and linking them to the specific objectives from the memo.
An Expert Response
Note on This Response
This is a sample expert response that effectively meets the requirements of the task. Your response may be different but equally valid if it is well-reasoned and correctly applies the principles of KPI selection.
TO: Plant Operations Director FROM: Asset Manager SUBJECT: Proposed KPIs for Northwood Plant Performance Improvement
Following your memo, I have analyzed the challenges at the Northwood Plant. To improve reliability, control costs, and ensure safety, I propose we track the following balanced set of Key Performance Indicators (KPIs). This mix of leading and lagging indicators will give us both a predictive view of our efforts and a clear picture of our results.
Objective 1: Improve Reliability
-
Lagging KPI: Mean Time Between Failures (MTBF)
- Measures: The average operational time of the P-101 pumps between breakdowns.
- Goal: Steadily increase MTBF to reduce service interruptions.
-
Leading KPI: Preventive Maintenance (PM) Compliance
- Measures: The percentage of scheduled preventive maintenance tasks completed on schedule for the P-101 pumps.
- Goal: Achieve and maintain >95% PM compliance.
Objective 2: Control Costs
-
Lagging KPI: Emergency Maintenance Costs
- Measures: The total cost (labor and materials) of unscheduled, reactive maintenance per month.
- Goal: Reduce emergency costs by 50% over the next two quarters.
-
Leading KPI: Maintenance Backlog
- Measures: The total number of approved but uncompleted work orders, measured in crew-weeks.
- Goal: Reduce the backlog to a manageable level of <2 weeks to ensure proactive work is prioritized.
Objective 3: Ensure Safety
-
Lagging KPI: Lost Time Injury Frequency Rate (LTIFR)
- Measures: The number of injuries causing lost work time per million hours worked.
- Goal: Maintain an LTIFR of zero.
-
Leading KPI: Number of Safety Observations & Corrective Actions
- Measures: The number of proactive safety observations reported by staff and the percentage of them that are closed with a corrective action.
- Goal: Increase reporting to foster a proactive safety culture and ensure 100% of actions are closed.
By monitoring these six KPIs, we can drive the right behaviors and make data-driven decisions to restore the Northwood Plant to a reliable, cost-effective, and safe level of performance.
Assess Yourself
Evaluate Your Work
Use the following criteria to critically evaluate your own KPI proposal against the expert response. This is an opportunity to identify areas of strength and opportunities for improvement in your thinking process.
- Objective Identification: Did you correctly identify reliability, cost control, and safety as the three primary objectives from the memo? High-quality work directly addresses the specific problems outlined in the source material.
- Indicator Differentiation: Does your proposal correctly categorize KPIs as either "leading" (predictive) or "lagging" (results)? A strong response demonstrates a clear understanding of how these two types of indicators work together.
- KPI Relevance: Are your chosen KPIs specific, measurable, and directly relevant to the objectives? Excellent work avoids vague metrics and selects indicators that provide actionable insight into the plant's performance.
- Balanced Approach: Does your set of KPIs provide a balanced view across all three objectives? A superior response avoids over-emphasizing one area (like cost) at the expense of others (like reliability or safety).
- Clarity of Proposal: Is your proposal formatted clearly and professionally, making it easy for a manager to understand your recommendations? The best responses are well-organized and communicate their points concisely.
Learning Progress
In this activity, you have practiced the essential skills of an asset manager. You have demonstrated your ability to differentiate between leading and lagging indicators, identify appropriate KPIs for key objectives like reliability and cost control, and propose a balanced set of metrics for a realistic professional scenario.
Next Steps
Excellent work applying the principles of KPI selection. You have successfully completed this skill-building activity. Please navigate back to the main course page to continue your learning journey.
