
The Skill Being Assessed
As an Asset Management Analyst for a municipal infrastructure department, you are responsible for monitoring the health of critical city assets. The city has recently invested in a network of advanced sensors on the historic Liberty Bridge to collect real-time performance data, moving from a reactive to a proactive maintenance strategy.
This assessment challenges you to apply your data analysis skills in a realistic professional context. You will work with raw sensor data to identify emerging issues, predict potential failures, and provide the clear, data-driven insights that leadership needs to make informed decisions about asset maintenance, ensuring public safety and optimizing resource allocation.
Your Task
As an Asset Management Analyst, your task is to analyze the provided sensor data from the Liberty Bridge and produce a concise analytical report for the Head of Infrastructure Maintenance. Your report should transform raw data into actionable intelligence.
Your submission must include three components: 1. A set of data visualizations (e.g., time-series plots) that clearly show the performance trends and any anomalies you discovered. 2. A brief, one-page summary report (in PDF format). This report must: * Summarize your key findings from the data. * Interpret what these findings mean for the structural health of the bridge. * Provide specific, data-supported recommendations for maintenance or further investigation. 3. The cleaned dataset you used for your analysis (in CSV format).
Resources and Data
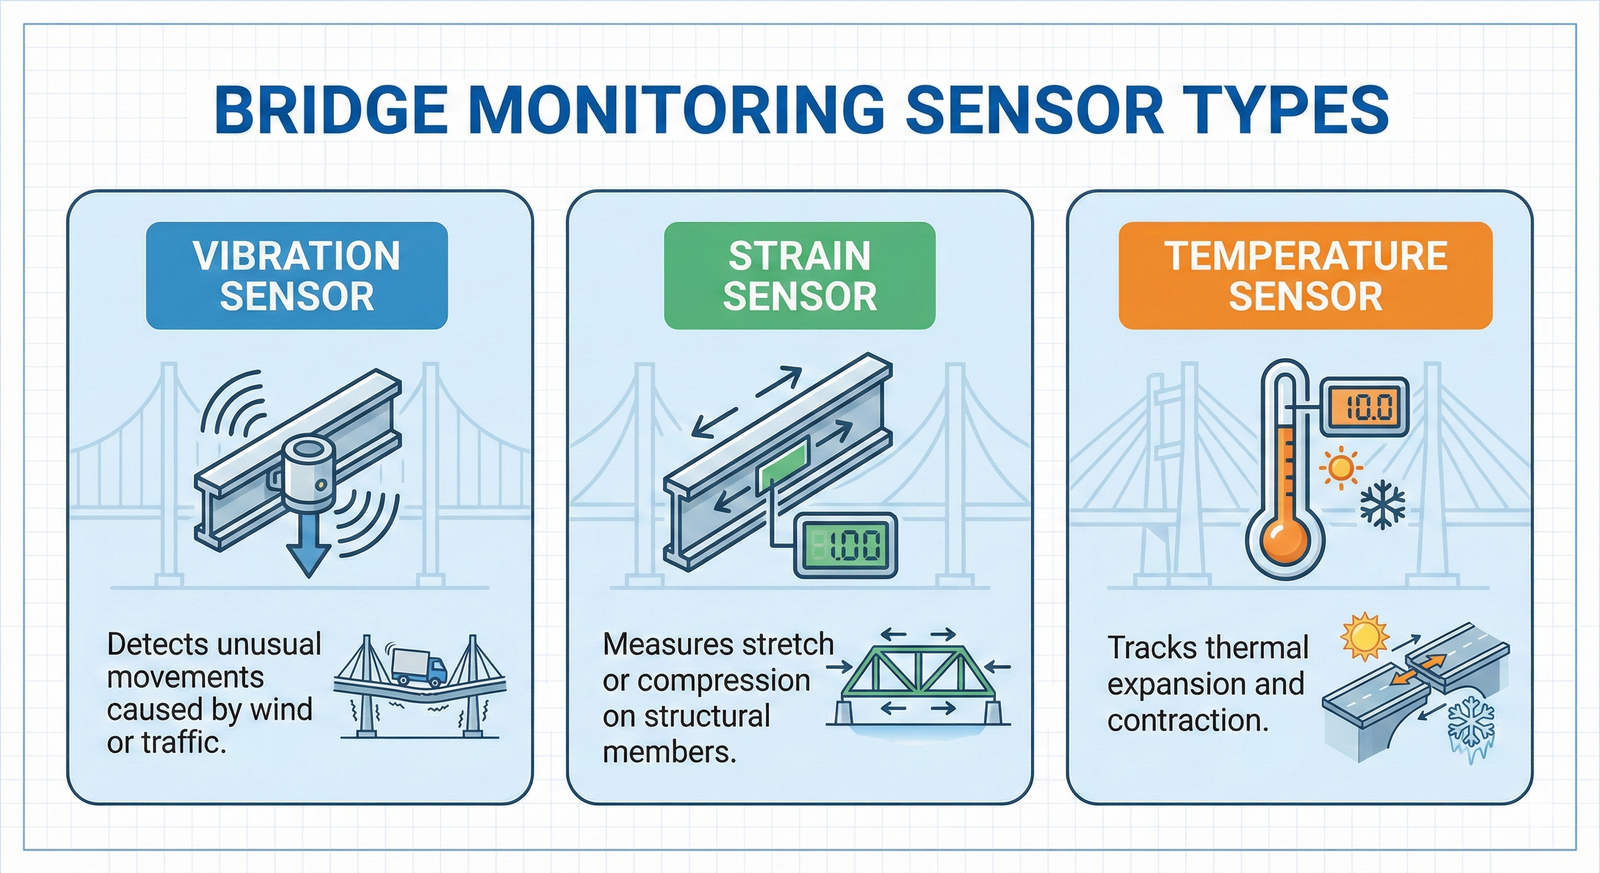
To complete this task, you are provided with a formal request memo from department leadership and the raw sensor data for the first quarter. An infographic is also included to clarify the function of each sensor type.
1. Project Memo: This document outlines the context and expectations for your analysis.
Key Document: MEMORANDUM: Liberty Bridge Sensor Data Initiative
2. Sensor Data: This file contains the raw, daily sensor readings from the Liberty Bridge for Q1 2024. Expect to perform some data cleaning before analysis.
Liberty Bridge - Daily Sensor Readings (Q1 2024)
| Date | Sensor ID | Sensor Type | Reading Value | Unit |
|---|---|---|---|---|
| 2023-01-02 | S-TMP-01 | Temperature | -2.5 | Celsius |
| 2023-01-03 | S-STR-01 | Strain | 155.4 | microstrain |
| 2023-01-04 | S-VIB-01 | Vibration | 2.1 | Hz |
| 2023-01-08 | S-VIB-02 | Vibration | 2.4 | Hz |
| 2023-01-10 | S-STR-02 | Strain | 210.7 | microstrain |
| 2023-01-12 | S-STR-01 | Strain | 178.9 | microstrain |
| 2023-01-15 | S-TMP-02 | Temperature | -4.1 | Celsius |
| 2023-01-18 | S-VIB-03 | Vibration | None | Hz |
| 2023-01-22 | S-STR-03 | Strain | 198.5 | microstrain |
| 2023-01-25 | S-STR-01 | Strain | 205.1 | microstrain |
| 2023-01-28 | S-TMP-01 | Temperature | 0.5 | Celsius |
| 2023-02-01 | S-VIB-02 | Vibration | 2.3 | Hz |
| 2023-02-04 | S-STR-02 | Strain | None | microstrain |
| 2023-02-06 | S-STR-01 | Strain | 240.6 | microstrain |
| 2023-02-09 | S-TMP-03 | Temperature | 1.2 | Celsius |
| 2023-02-12 | S-VIB-01 | Vibration | 2.6 | Hz |
| 2023-02-14 | S-VIB-02 | Vibration | 2.8 | Hz |
| 2023-02-15 | S-VIB-01 | Vibration | 2.5 | Hz |
| 2023-02-15 | S-VIB-02 | Vibration | 28.4 | Hz |
| 2023-02-15 | S-VIB-03 | Vibration | 2.2 | Hz |
| 2023-02-16 | S-VIB-02 | Vibration | 31.2 | Hz |
| 2023-02-17 | S-VIB-02 | Vibration | 3.1 | Hz |
| 2023-02-18 | S-STR-01 | Strain | 285.3 | microstrain |
| 2023-02-20 | S-TMP-02 | Temperature | None | Celsius |
| 2023-02-22 | S-STR-03 | Strain | 205.9 | microstrain |
| 2023-02-25 | S-VIB-03 | Vibration | 1.9 | Hz |
| 2023-02-28 | S-STR-01 | Strain | 321.8 | microstrain |
| 2023-03-01 | S-TMP-01 | Temperature | 5.6 | Celsius |
| 2023-03-03 | S-VIB-02 | Vibration | 2.7 | Hz |
| 2023-03-05 | S-STR-02 | Strain | 215.4 | microstrain |
| 2023-03-08 | S-TMP-03 | Temperature | None | Celsius |
| 2023-03-10 | S-STR-01 | Strain | 365.2 | microstrain |
| 2023-03-12 | S-VIB-01 | Vibration | 2.4 | Hz |
| 2023-03-15 | S-STR-03 | Strain | None | microstrain |
| 2023-03-18 | S-TMP-02 | Temperature | 8.9 | Celsius |
| 2023-03-21 | S-STR-01 | Strain | 401.7 | microstrain |
| 2023-03-24 | S-VIB-03 | Vibration | 2.3 | Hz |
| 2023-03-26 | S-TMP-01 | Temperature | 10.1 | Celsius |
| 2023-03-28 | S-STR-02 | Strain | 218.0 | microstrain |
| 2023-03-30 | S-STR-01 | Strain | 448.5 | microstrain |
3. Sensor Types Infographic: This graphic explains the purpose of the different sensors installed on the bridge.
Submit Your Work
Insert DropBox here
Next Steps
Excellent work applying your analytical skills to this real-world challenge. You have successfully completed the skill assessment. Please navigate back to the main course page to continue your learning journey.