
Introduction
Welcome. If you're managing physical or infrastructure assets, you know that your world is built on data. For decades, we've relied on spreadsheets, maintenance logs, and periodic inspections to make critical decisions about repairs, replacements, and budgets. These tools have served us well, but they are fundamentally reactive. They tell us what has happened, not what is about to happen.
This is where the conversation is changing. You've likely heard the term "Machine Learning" and may associate it with tech giants or complex academic research. The reality is that machine learning is rapidly becoming one of the most powerful tools in the asset manager's toolkit. It's not about replacing your experience or judgment; it's about augmenting it. It's about shifting from a reactive or preventive posture to a truly predictive one, allowing you to anticipate failures, optimize maintenance schedules, and allocate resources with a level of precision we could only dream of a generation ago.
In this reading, we're going to demystify the core concepts. We'll move past the buzzwords and focus on what you, as a practitioner, need to know. We'll explore the fundamental types of machine learning and, more importantly, see how specific algorithms can be applied to solve the real-world problems you face every day.
The Shift to Data-Driven Decisions
For a long time, asset management strategy was dominated by two approaches: reactive maintenance (fixing things when they break) and preventive maintenance (fixing things on a fixed schedule, regardless of condition). While preventive maintenance was a huge leap forward, it's often inefficient. You might replace a part that had another year of life in it, or a component might fail unexpectedly just before its scheduled service.
The rise of affordable sensors, IoT (Internet of Things) devices, and powerful computing has given us an unprecedented amount of data about our assets: temperature, vibration, pressure, output, cycle counts, and more. The challenge is no longer about getting data; it's about making sense of it. This is the problem that Machine Learning Algorithms are designed to solve. They are the "brains" that can sift through millions of data points to find the subtle patterns that signal an impending failure or an opportunity for optimization.
The Two Main Flavors of Machine Learning: Supervised and Unsupervised
At a high level, most machine learning approaches can be sorted into two main categories: supervised learning and unsupervised learning. Understanding this distinction is the first step to understanding how and where to apply these tools.
📊 View Diagram: Supervised vs. Unsupervised Learning
Supervised Learning: Learning from the Past
Think of supervised learning as teaching a new team member by showing them examples. You provide a dataset that includes not only the input data (the "questions") but also the correct output data (the "answers"). The algorithm's job is to learn the relationship, or the "rules," that connect the inputs to the outputs.
For instance, you could give the algorithm a massive dataset of historical pump data—vibration levels, temperature, age, operating hours—and for each record, you'd include the known outcome: whether the pump failed within the next 30 days. The algorithm learns the patterns associated with failure. Once it's "trained," you can give it new data from a current pump, and it will predict the likelihood of failure.
The key here is "supervised"—we are supervising the learning process by providing labeled, historical data with known outcomes. This is incredibly powerful for prediction tasks.
Unsupervised Learning: Finding Hidden Patterns
Now, imagine giving that same new team member a massive, unorganized box of spare parts and just saying, "Find a way to organize these." They wouldn't have a pre-defined set of categories. Instead, they would start looking for similarities—grouping all the bolts of a certain size together, separating copper fittings from steel ones, and so on. They are discovering the inherent structure in the data on their own.
This is the essence of unsupervised learning. You provide the algorithm with a dataset that does not have pre-labeled outcomes or correct answers. The algorithm's task is to explore the data and find meaningful structures, groups, or anomalies all by itself. You might use this to analyze a fleet of vehicles and discover that they naturally fall into three distinct usage profiles (e.g., "city-driving," "highway-hauling," "rural-idling") based on their telematics data, without you ever defining those categories beforehand.
The Core Distinction
The fundamental difference lies in the data you use to train the model. Supervised learning uses labeled data (you know the answers) to make predictions. Unsupervised learning uses unlabeled data to discover hidden patterns and structures.
Now, let's get more specific and look at three of the most common and useful types of algorithms in asset management: two supervised (Regression and Classification) and one unsupervised (Clustering).
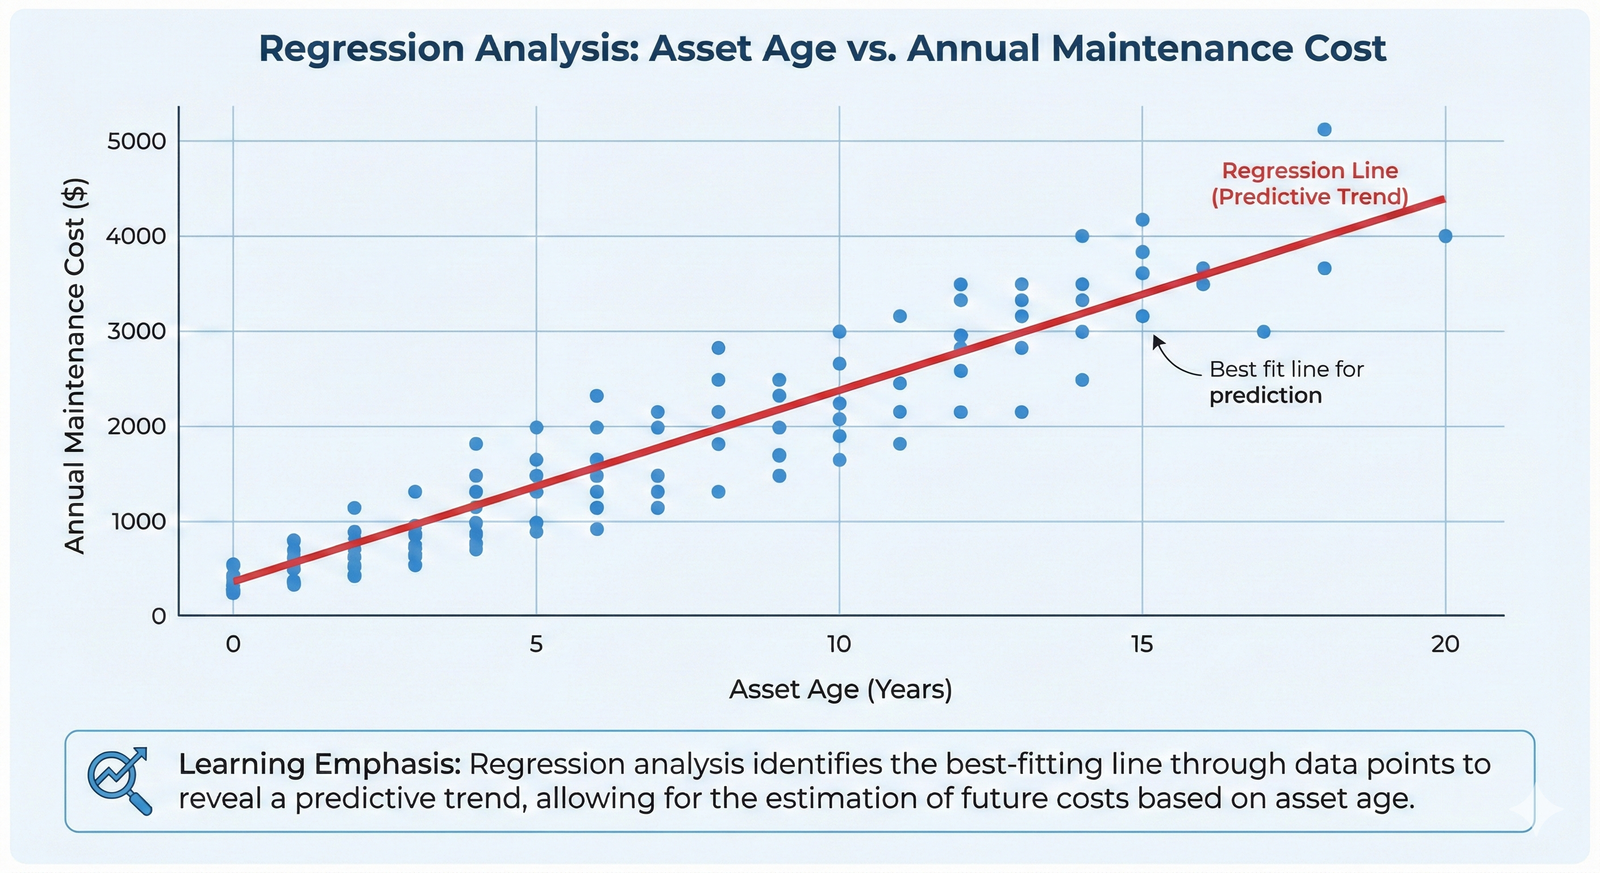
Application 1: Regression – Predicting a Number
When your goal is to predict a continuous numerical value, you're in the realm of Regression. Think of it as drawing the "best-fit line" through a complex, multi-dimensional set of data points.
Professional Context: Predicting Remaining Useful Life (RUL)
One of the holy grails in asset management is knowing not just if an asset will fail, but when. This is a perfect job for regression.
Imagine you manage a fleet of critical HVAC units for a large hospital. An unexpected failure is not an option. You have sensor data streaming in: compressor temperature, fan vibration, coolant pressure, and energy consumption. You also have a detailed maintenance history, including the age of each unit and, crucially, data on past failures.
You can build a regression model that takes the current sensor readings and age as inputs and predicts a single number as the output: the Remaining Useful Life (RUL) in days.
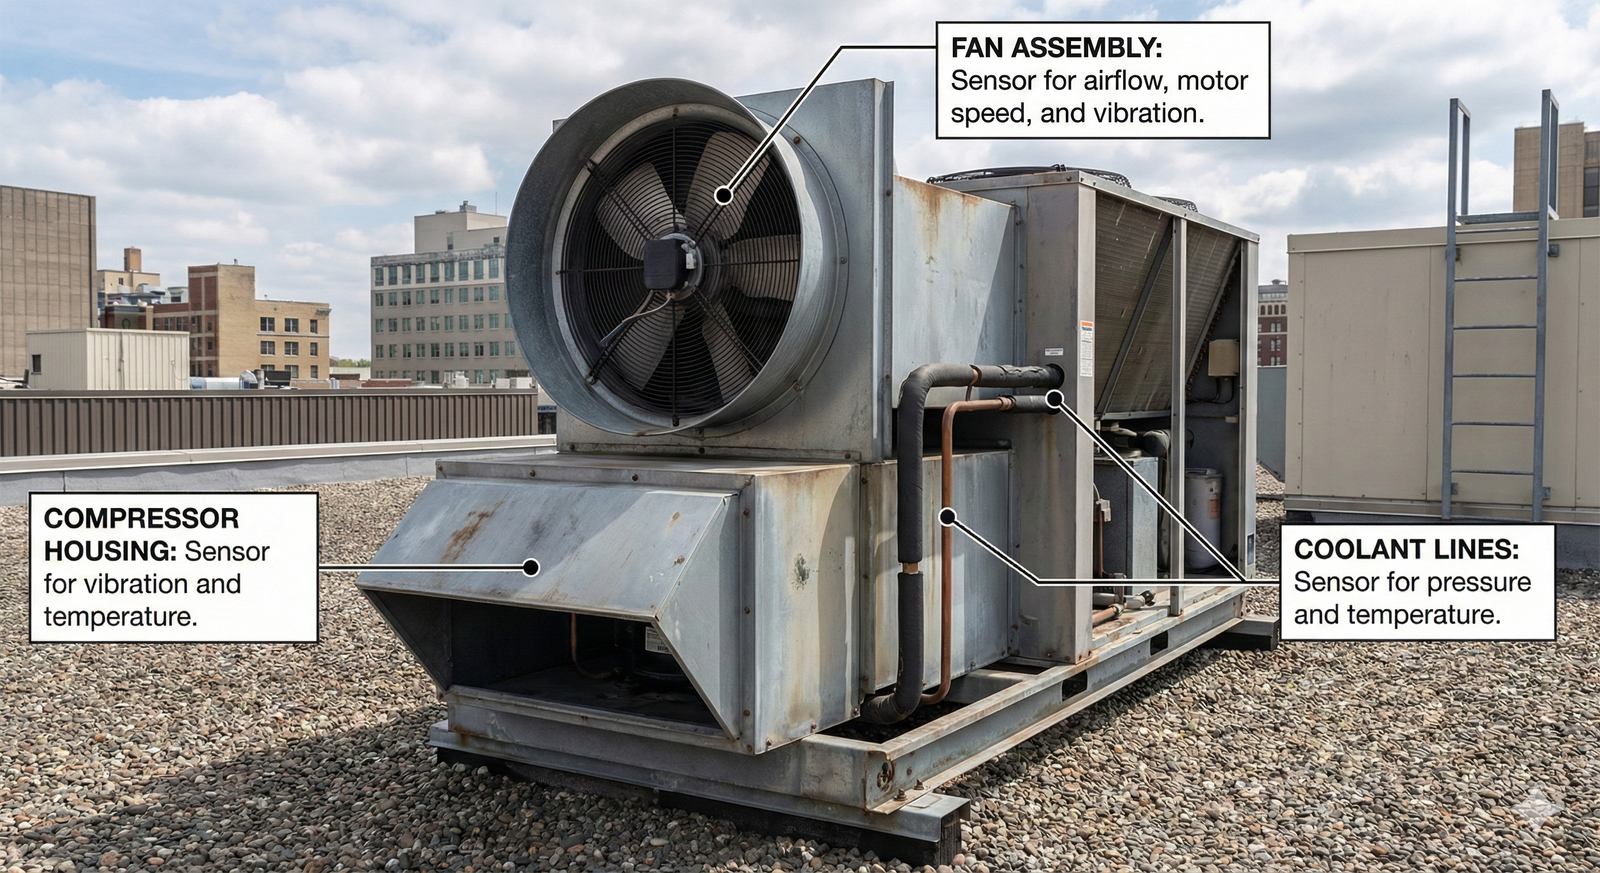
The model might learn that a specific combination of rising compressor temperature and a slight increase in fan vibration is a strong predictor that a unit has, for example, only 60 days of life left. This allows you to move from a generic "service every 6 months" schedule to a condition-based "service this specific unit in the next 45 days" strategy. This saves money on unnecessary servicing and dramatically reduces the risk of unplanned downtime.
To give you a feel for the kind of data used, here is a simplified sample.
Sample Data for RUL Regression Model
| Unit ID | Age Months | Avg Vibration mm s | Avg Temp C | Remaining Useful Life Days |
|---|---|---|---|---|
| HVAC-101 | 2 | 0.21 | 75.5 | 3621 |
| HVAC-102 | 12 | 0.35 | 78.1 | 3250 |
| HVAC-103 | 118 | 3.88 | 104.2 | 45 |
| HVAC-104 | 48 | 0.95 | 84.6 | 1890 |
| HVAC-105 | 96 | 2.15 | 95.3 | 412 |
| HVAC-106 | 60 | 1.76 | 91.8 | 985 |
| HVAC-107 | 7 | 0.29 | 76.9 | 3455 |
| HVAC-108 | 72 | 1.12 | 88.1 | 1350 |
| HVAC-109 | 110 | 3.41 | 101.5 | 110 |
| HVAC-110 | 24 | 0.55 | 80.4 | 2880 |
| HVAC-111 | 85 | 2.95 | 98.7 | 530 |
| HVAC-112 | 36 | 0.78 | 82.2 | 2315 |
| HVAC-113 | 120 | 4.1 | 108.9 | 21 |
| HVAC-114 | 55 | 0.89 | 85.0 | 1650 |
| HVAC-115 | 102 | 2.5 | 96.8 | 250 |
| HVAC-116 | 18 | 0.42 | 79.3 | 3010 |
| HVAC-117 | 90 | 3.11 | 99.4 | 488 |
Application 2: Classification – Assigning a Category
What if your question isn't "how much?" or "how many?" but "which one?" or "what kind?" When you need to predict a discrete category or label, you'll use a Classification algorithm.
Professional Context: Assessing Pipeline Corrosion Risk
Consider the immense challenge of managing thousands of kilometers of buried water pipelines. A primary threat is corrosion, but you can't dig up every meter of pipe to check it. However, you have data: pipe material, age, soil type, water chemistry reports, and historical leak data.
Your goal is to classify each 100-meter segment of pipe into one of three risk categories: "Low Risk," "Medium Risk," or "High Risk."
This is a classification problem. You would train a model using a historical dataset where you have the input features (pipe age, soil pH, etc.) and the known outcome (segments that previously leaked or were found to be highly corroded upon inspection were labeled "High Risk").

Once trained, the model can analyze the data for every segment in your entire network and produce a color-coded risk map. This doesn't tell you the exact day a pipe will fail (that's regression), but it tells you where to focus your limited inspection and replacement budget. Instead of digging randomly or replacing pipes based only on age, you can now surgically target the segments that the model has classified as "High Risk."
Binary vs. Multi-Class Classification
Classification problems can be simple or complex. A binary classification has only two outcomes (e.g., 'Will Fail' / 'Will Not Fail'). A multi-class classification, like our pipeline example, has three or more outcomes ('High' / 'Medium' / 'Low' Risk). The underlying approach is similar, but the problem framing is different.
Application 3: Clustering – Discovering Hidden Groups
Finally, let's turn to our unsupervised method. Clustering is all about finding natural groupings in your data without any preconceived notions of what those groups should be.
Professional Context: Optimizing a Vehicle Fleet
Imagine you manage a large fleet of 500 delivery vans. The manufacturer recommends a single maintenance schedule for all of them. But you know they aren't all used the same way. Some probably spend all day in stop-and-go city traffic, which is hard on brakes and transmissions. Others might do long, easy highway miles.
You have telematics data for every van: GPS logs, speed, engine RPM, idle time, and fuel consumption. You feed this unlabeled data into a clustering algorithm.
The algorithm might come back and identify three distinct clusters: * Cluster 1 (The "Urban Warriors"): Characterized by low average speed, high idle time, and frequent hard braking. * Cluster 2 (The "Highway Cruisers"): Characterized by high average speed, low idle time, and consistent engine RPM. * Cluster 3 (The "Mixed-Use Hybrids"): A group that falls somewhere in between.
📊 View Diagram: Clustering Vehicle Usage Patterns
This discovery is incredibly valuable. You haven't predicted a failure, but you've uncovered operational intelligence. You can now design custom maintenance schedules. The "Urban Warriors" might need more frequent brake and transmission fluid checks, while the "Highway Cruisers" can have longer intervals between oil changes but might need more frequent tire inspections. By tailoring maintenance to actual usage patterns, you reduce costs, improve fleet reliability, and extend the life of your assets.
Closing
We've covered the foundational concepts that are driving the next wave of innovation in physical and infrastructure asset management. The journey begins with understanding the crucial difference between supervised learning, where we teach a model using data with known answers, and unsupervised learning, where we ask the model to find the answers for us by discovering hidden structures in the data.
By grounding these concepts in practical applications, you can see how they translate from theory into tangible value. Regression gives you the power to forecast numerical outcomes, like the remaining life of a critical component. Classification allows you to sort assets into meaningful categories, like a "High Risk" or "Low Risk" pipeline segment, enabling you to prioritize your actions. And clustering provides a new lens through which to view your operations, revealing patterns like vehicle usage profiles that allow for smarter, more efficient strategies.
This is not science fiction. These are tools that are being deployed today to make infrastructure safer, more reliable, and more cost-effective. As an asset manager, you don't need to become a data scientist, but understanding these principles will enable you to ask the right questions, work effectively with technical teams, and champion the data-driven strategies that will define the future of our profession.
Learning Outcomes
In this reading, you have built a foundational understanding of key machine learning concepts as they apply to asset management.
You can now explain the difference between supervised learning (using labeled data to make predictions) and unsupervised learning (using unlabeled data to find patterns). You are also able to describe the practical application of three core algorithm types:
- Regression: You can describe how it's used to predict continuous values, such as an asset's Remaining Useful Life.
- Classification: You can describe its use in assigning assets to specific categories, such as a 'High-Risk' status.
- Clustering: You can describe how this unsupervised method is used to discover hidden groupings in data, like different usage patterns in a vehicle fleet.
Assess Yourself
❓ Knowledge Check
Test your understanding of the key concepts from this section.
Next Steps
You have successfully completed this introduction to machine learning algorithms in asset management. This foundational knowledge will be invaluable as you continue to explore more advanced data-driven strategies. Please navigate back to the course page to continue your learning journey.

