
Introduction
Imagine you're responsible for a critical water pumping station that serves thousands of households. One of its main pumps has been in service for years. You know it will fail eventually, but when? A failure without warning could disrupt service, lead to costly emergency repairs, and damage public trust. A replacement that's too early wastes money and resources on a perfectly good asset. How do you move from guessing to knowing?
This is a fundamental challenge in physical and infrastructure asset management. We are often swimming in data—pressure readings, vibration signatures, temperature logs, energy consumption—collected every minute of every day. On its own, it's just noise. But when structured and analyzed correctly, this data tells a story about the health of our assets and can help us predict the future. This is the power of forecasting with time-series analysis. It's the tool that allows you to listen to what your assets are telling you, enabling a shift from reactive, costly fixes to proactive, data-driven interventions. In this reading, we'll explore how to turn that stream of data into actionable intelligence.
From Data Points to Future Insights
At its heart, asset management is about making the best possible decisions with the resources you have. For decades, many of those decisions were based on manufacturers' recommendations, historical breakdown averages, or simple, time-based maintenance schedules. You replace a filter every six months or overhaul a generator every 10,000 operating hours because that's "how it's always been done." This approach is reliable, but it's not optimized. It doesn't account for the unique operating conditions or actual health of an individual asset.
The game changed with the widespread adoption of sensors and digital control systems (SCADA). Suddenly, we had access to a continuous stream of data for each asset. The challenge then became: what do we do with it all? The answer lies in treating that data as a Time-Series Analysis. This isn't just about plotting a graph; it's about systematically decomposing the data to understand its underlying structure and build a model that can forecast its future behavior.
Deconstructing the Signal: What Your Data is Made Of
A time-series dataset, like the hourly vibration readings from a turbine, might look like a chaotic scribble at first. However, it can almost always be broken down into three core components:
- Trend: This is the long-term direction of the data. Is the average vibration slowly increasing over months? That's a trend. It might indicate gradual wear and tear.
- Seasonality: This refers to predictable, repeating patterns over a fixed period. Does a pump's energy consumption spike every weekday morning when a factory starts up? That's a daily seasonal pattern. Does a bridge's expansion joint sensor show more movement in the summer than in the winter? That's an annual seasonal pattern.
- Residuals (or Noise): This is what's left over after you account for the trend and seasonality. It's the random, unpredictable fluctuation in the data. While some of it is truly random noise, sometimes a sudden spike in the residuals can be the first sign of an anomaly or an impending fault.
Understanding these components is the first step in forecasting. By separating the predictable parts (trend and seasonality) from the unpredictable (residuals), we can build a model of the asset's normal behavior.
📊 View Diagram: Decomposition of Time-Series Data
The Shift to Proactive Maintenance
Time-series forecasting is the engine of predictive maintenance (PdM). Instead of waiting for an asset to fail (reactive) or servicing it on a fixed schedule (preventive), PdM uses data analysis to predict when a failure is likely to occur. This allows you to schedule maintenance at the optimal moment: just before performance degrades or a failure happens. The result is maximized asset uptime, reduced maintenance costs, and increased safety.
The Art of Feature Engineering: Creating Meaning from Data
A forecasting model rarely works well with just one raw stream of data. The real magic happens in a process called Feature Engineering. This is where your expertise as an asset manager is invaluable. You understand the physical reality behind the data points, and you can use that knowledge to create new variables—features—that make the underlying patterns easier for a model to detect.
Think of a pump's motor. We might be collecting a constant stream of data from a vibration sensor attached to its casing.

The raw vibration data is useful, but we can engineer more powerful features from it:
- Rolling Averages: Instead of just the instantaneous vibration, what about the average vibration over the last hour? Or the last 24 hours? A rolling average smooths out random noise and can make the underlying trend much clearer.
- Lag Features: How does today's vibration compare to yesterday's? Or last week's? A "lag feature" is simply a data point from a previous time step. This helps the model understand the momentum or autocorrelation in the data.
- Time-Based Features: Is it a weekday or a weekend? A morning or an evening? Is it a particular season? Creating features that explicitly state this temporal context can help the model learn seasonal patterns.
- Interaction Features: What if vibration only becomes a problem when temperature is also high? You could create an interaction feature by multiplying the vibration value by the temperature value. This helps the model learn complex, conditional relationships.
This process transforms a simple, one-dimensional list of numbers into a rich, multi-dimensional dataset that gives your model a much better chance of success.
Table 1: Example of Raw Data vs. Engineered Features
| Timestamp | Vibration mm s | Rolling Avg 3hr | Lag 24hr | Is Weekend |
|---|---|---|---|---|
| 2023-10-27T20:00:00Z | 0.62 | 0.61 | 0.58 | 0 |
| 2023-10-27T21:00:00Z | 0.65 | 0.63 | 0.59 | 0 |
| 2023-10-27T22:00:00Z | 0.64 | 0.64 | 0.6 | 0 |
| 2023-10-27T23:00:00Z | 0.68 | 0.66 | 0.61 | 0 |
| 2023-10-28T00:00:00Z | 0.66 | 0.66 | 0.62 | 1 |
| 2023-10-28T01:00:00Z | 0.69 | 0.67 | 0.62 | 1 |
| 2023-10-28T02:00:00Z | 0.7 | 0.68 | 0.63 | 1 |
| 2023-10-28T03:00:00Z | 0.68 | 0.69 | 0.64 | 1 |
| 2023-10-28T04:00:00Z | 0.71 | 0.7 | 0.65 | 1 |
| 2023-10-28T05:00:00Z | 0.72 | 0.7 | 0.65 | 1 |
| 2023-10-28T06:00:00Z | 0.73 | 0.72 | 0.66 | 1 |
| 2023-10-28T07:00:00Z | 0.71 | 0.72 | 0.67 | 1 |
Choosing Your Forecasting Tool
Once you have your engineered features, it's time to select a forecasting model. There is a vast ecosystem of algorithms, each with its strengths and weaknesses. You don't need to be a data scientist to get started, but it helps to know the conceptual difference between a few common types:
- Classical Statistical Models (like ARIMA): These are the workhorses of time-series forecasting. ARIMA (AutoRegressive Integrated Moving Average) is a model that looks at the past values (AutoRegressive), the trend (Integrated), and past forecast errors (Moving Average) to predict the future. They are excellent for data with clear, stable trends and seasonality. They are transparent and relatively easy to interpret.
- Machine Learning Models (like LSTMs): For more complex, non-linear relationships, we often turn to machine learning. Long Short-Term Memory (LSTM) networks are a type of recurrent neural network that is exceptionally good at learning long-term dependencies in sequential data. They can capture intricate patterns that simpler models might miss, but they often require more data and can be more of a "black box," making them harder to interpret.
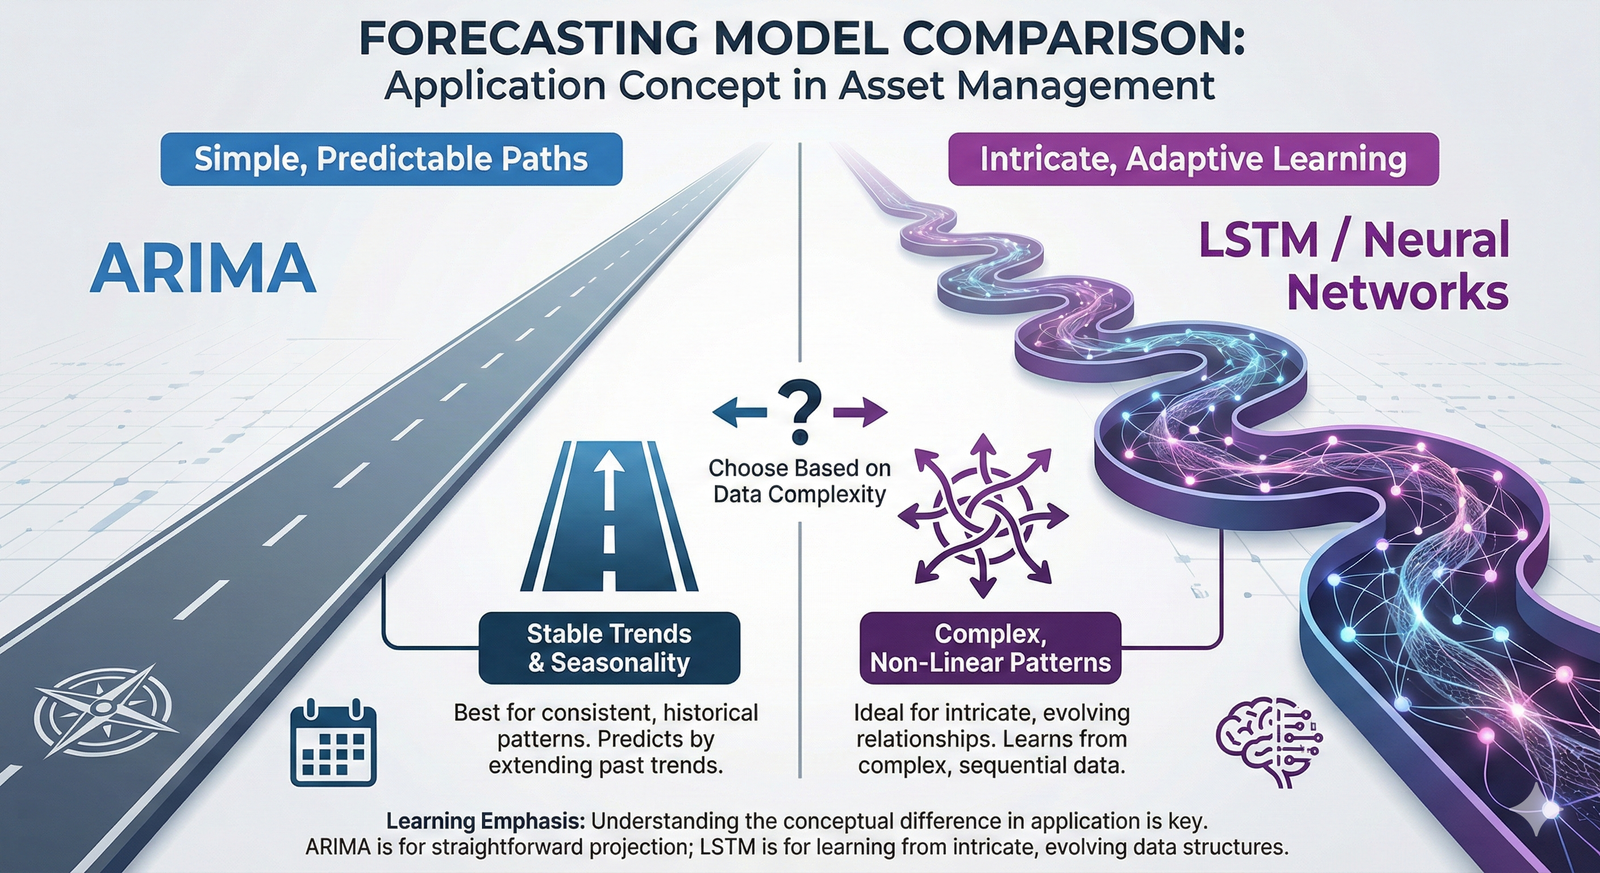
The choice of model depends on your specific problem, the amount and quality of your data, and your need for interpretability. Often, the best approach is to start simple and only increase complexity if necessary.
The Moment of Truth: Model Validation
You've built a model, and it produces a forecast. How do you know if it's any good? You would never install a new piece of equipment without testing it, and the same discipline must apply to predictive models. This critical step is called Model Validation.
The most fundamental technique for validation is to split your historical data. You use one portion—typically the larger, earlier part—to train the model. This is the data the model gets to "see" and learn from. The remaining portion—the later part—is held back as a "test set."
You then use your trained model to make predictions for the time period covered by the test set and compare your model's forecasts to the actual, real-world values that occurred. The difference between the predicted and actual values is the error. By calculating metrics like Mean Absolute Error (MAE) or Root Mean Squared Error (RMSE), you get a quantitative measure of how accurate your model is likely to be in the real world.
The Danger of Overfitting
A common pitfall is 'overfitting.' This happens when a model learns the training data too well, including its random noise. It's like a student who memorizes the answers to a practice exam but doesn't understand the concepts. The model will perform brilliantly on the data it has already seen but will fail badly when it encounters new, real-world data. Rigorous validation with a separate test set is your primary defense against overfitting.
This validation process isn't just a pass/fail test. It's an iterative loop. If the model's performance isn't good enough, you go back. Do you need better data? More thoughtful feature engineering? A different type of model? This cycle of building, testing, and refining is at the core of developing a reliable and trustworthy forecasting system for your assets.
Closing
We began with a simple question: how can you know when a critical asset might fail? As we've seen, the answer isn't found in a crystal ball but in a disciplined approach to data. By treating the performance data from our assets as a time series, we can move beyond simple monitoring. We can decompose the signal to understand its fundamental patterns, engineer features that add meaningful context, and build models that forecast future behavior.
This process, which fulfills the core principles of applying forecasting techniques to optimize asset performance (piam-s-3-2), is transformative. It allows you, the asset manager, to shift your strategy from being reactive to being predictive. It empowers you to make targeted, timely interventions that save money, improve reliability, and enhance safety. The journey from raw data to a reliable forecast requires careful thought at each step—from feature engineering to model validation—but the payoff is a deeper understanding of your assets and a more resilient, efficient operation.
Learning Outcomes
In this reading, you have explored the foundational concepts of using data to predict the future performance of physical assets. You should now have a solid understanding of the following:
- You can now describe the process of using Time-Series Analysis to forecast asset behavior by identifying trends, seasonality, and residuals in performance data.
- You are able to explain the critical role of Feature Engineering in transforming raw data into meaningful inputs for a predictive model.
- You can articulate why Model Validation is an essential, non-negotiable step to ensure a forecasting model is trustworthy and will perform accurately on new, unseen data.
Assess Yourself
Test your understanding of the key concepts from this reading. This short quiz is for your self-assessment only and will not be graded.
❓ Knowledge Check
Test your understanding of the key concepts from this section.
Next Steps
Great work completing this reading. You've taken a significant step in understanding how to leverage data for smarter asset management. When you are ready, please navigate back to the course to continue your learning journey.
