
Introduction
Welcome to the core of modern asset management. If you're new to the field, you might be picturing yourself out on-site, inspecting bridges or walking the length of a pipeline. That's part of the job, but the real power of an asset manager lies in the decisions you make back in the office. How do you decide which of 500 pumps to replace first? Which of 1,000 kilometers of road to resurface with a limited budget? These aren't guesses. They are calculated choices based on information.
In this profession, data is your most valuable tool. It transforms asset management from a reactive, "fix-it-when-it-breaks" cycle into a proactive, strategic function that optimizes value and manages risk for an organization. This reading will guide you through the fundamental types of asset information and, more importantly, how to use them to make sound, defensible decisions. We'll move from the foundational elements to a practical scenario, showing you how data flows from the asset itself to a strategic choice.
The Single Source of Truth: Your Asset Register
Before you can analyze anything, you have to know what you have. This seems obvious, but you'd be surprised how many organizations have an incomplete or scattered picture of their own assets. The starting point for all asset management activities is the Asset Register.
Think of it as a comprehensive inventory. For a water utility, this register would list every pipe, pump, valve, and treatment tank. For a city's transportation department, it would include every road segment, bridge, traffic signal, and culvert. At a minimum, the register contains unique identifiers, location, type, and key attributes for each asset. Without a reliable asset register, you are flying blind.
The Foundation of Decision-Making
An incomplete or inaccurate Asset Register undermines every subsequent asset management activity. All data, from condition scores to financial costs, is linked back to a specific asset in the register. If the asset isn't listed, its data has nowhere to live, and the asset itself becomes invisible to your strategic planning.
The Core Information Types
Once your asset register is in place, you can begin to layer on the rich information that will drive your decisions. We can group this information into several key categories. Each one answers a different, vital question about your assets.
What is its physical state? Answering with Condition Data
The most intuitive type of data is Condition Data. This information tells you about the physical health of an asset. It's what you gather from visual inspections, non-destructive testing, or sensor readings.
Examples include: * The percentage of corrosion on a steel beam. * The number and severity of cracks in a concrete pavement. * The remaining wall thickness of a pressurized pipe. * A "condition score" from 1 (Excellent) to 5 (Failed) assigned by an inspector.

Condition data is the primary input for "Repair, Refurbish, or Replace" decisions. By tracking an asset's condition over time, you can predict its remaining useful life and intervene before a catastrophic failure occurs. This is the basis of preventive and condition-based maintenance strategies.
How well is it doing its job? Answering with Performance Data
While condition tells you about an asset's physical state, it doesn't always tell you if it's meeting its purpose. For that, you need Performance Data. This data measures how an asset is functioning.
Examples include: * The flow rate and pressure of a water pump. * The energy consumption (kWh) of an HVAC unit in a building. * The number of unplanned outages for a power distribution line. * The average travel time on a specific road corridor.
An asset can be in good physical condition but perform poorly. A pump might be free of corrosion (good condition) but be so inefficient that its energy costs are astronomical (poor performance). A road might have a perfect surface (good condition) but be so congested that it fails to provide an acceptable level of service (poor performance).
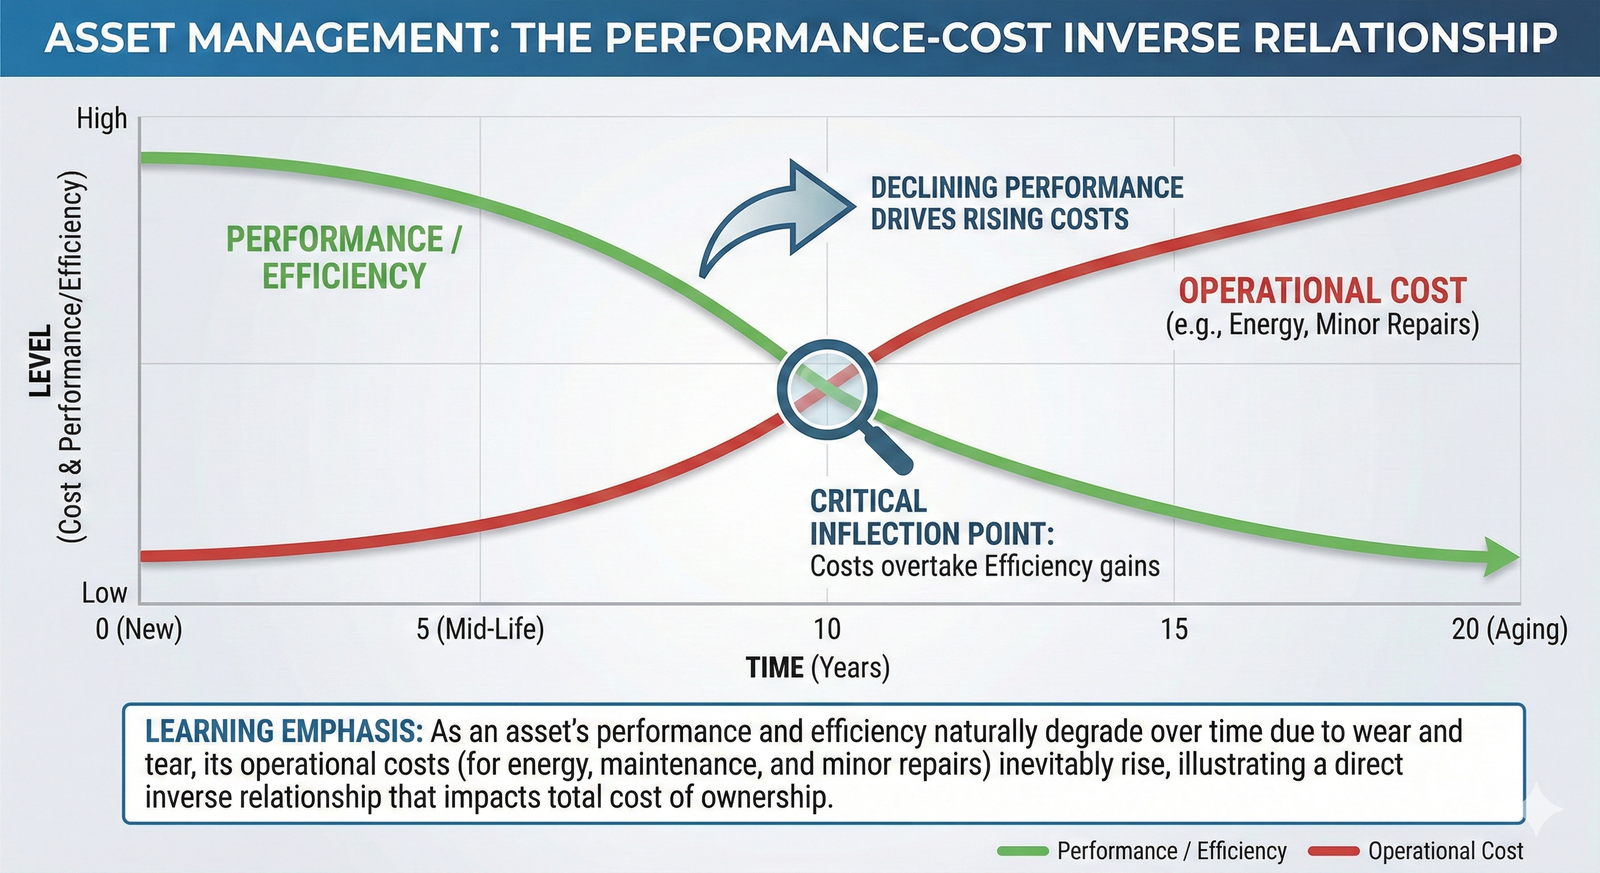
Performance data is critical for optimizing operations, identifying inefficiencies, and justifying investments in upgrades that improve the level of service.
What is it worth? Answering with Financial Data
Assets don't just exist; they are financial instruments. They are purchased, they cost money to maintain, and they eventually need to be replaced. Understanding their monetary value is essential. This is where Financial Data comes in.
Examples include: * Initial purchase and installation cost. * Annual maintenance and operational expenditures. * Calculated depreciation. * Estimated current replacement value. * The financial consequence of failure (e.g., lost revenue, emergency repair costs).
Financial data allows you to perform lifecycle cost analysis, comparing the long-term costs of different options. Is it cheaper to keep repairing an old asset, or to replace it with a new, more efficient one? Financial data provides the answer. It is the language that connects asset management decisions to the organization's overall budget and financial strategy. You can't ask for millions of dollars for an infrastructure project without a solid business case built on financial data.
Where is it? Answering with Geospatial Data
The location of an asset is more than just an address. Its position relative to other assets, to the environment, and to the community it serves is a critical piece of the puzzle. Geospatial data, often managed in a Geographic Information System (GIS), provides this context.
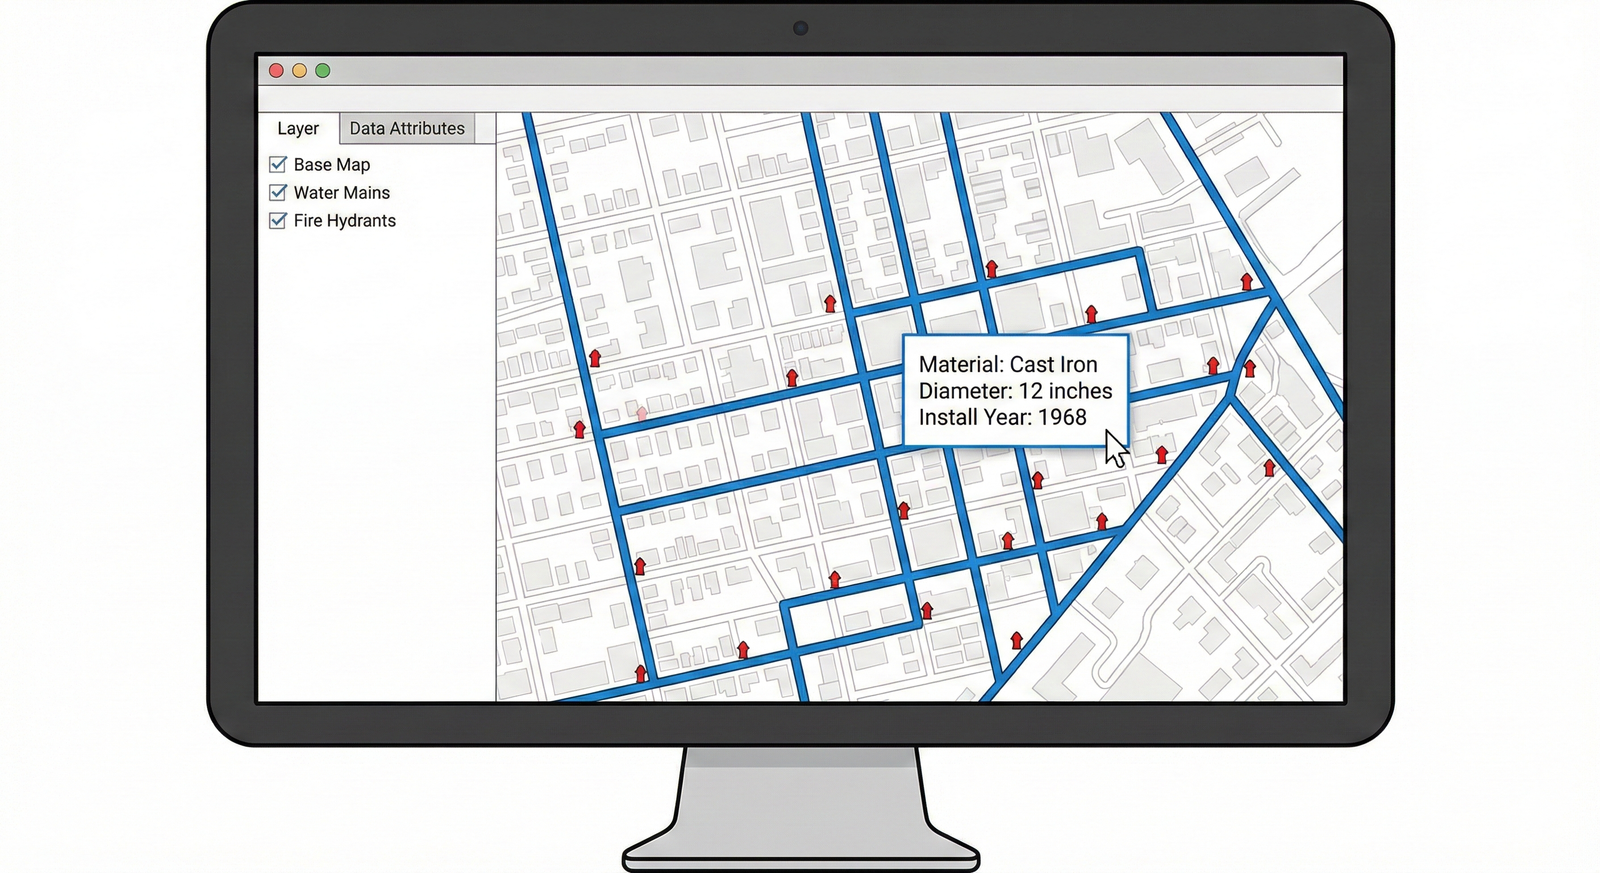
Geospatial data helps answer questions like: * Which water valves need to be closed to isolate a specific pipe for repair? * Which communities will be affected by a planned power outage? * Is this critical bridge located in an earthquake-prone zone or a flood plain? * What is the most efficient route for a crew to inspect 50 assets in one day?
By visualizing data on a map, you can spot patterns, understand risks, and plan work in a way that is simply impossible with spreadsheets alone.
From Data to Decision: A Practical Scenario
Let's put this all together. Imagine you are the Asset Manager for the City of Northwood's water utility. You receive a report that a critical 24-inch cast iron water main, installed in 1972, runs directly under the city's main hospital. There hasn't been a failure, but your team is concerned. Your director asks for a recommendation: "Should we proactively replace this pipe section next year, or can it wait?"
How do you answer? You don't guess. You gather the data.
📊 View Diagram: Data-Driven Decision Flow: Water Main Replacement
-
Asset Register: You start here. You confirm the pipe's attributes: 24-inch diameter, cast iron, installed 1972. The register also tells you its maintenance history—or lack thereof.
-
Condition Data: You need to know its health. You can't just dig it up, so you commission a remote inspection using a robotic CCTV camera. The footage shows significant internal tuberculation (crusty buildup) and some joint-weeping. You also pull soil analysis records for the area, which show the soil is highly corrosive. You check the leak history; there have been two minor repairs on this segment in the last five years.
-
Performance Data: You look at data from the Supervisory Control and Data Acquisition (SCADA) system. You notice that maintaining pressure in this zone requires more and more pumping energy, likely due to the friction from the internal buildup. Water quality tests have also occasionally shown slightly elevated iron content for customers downstream.
-
Geospatial Data: The GIS system confirms the worst: the pipe runs directly under the main ambulance entrance to the hospital. A failure here would be catastrophic for emergency services. The map also shows that it's tangled with a major fiber optic trunk and a high-voltage electrical duct. A break would be a complex, multi-utility nightmare.
-
Financial Data: You task your analyst with running the numbers.
- Proactive Replacement Cost: A planned project, with traffic rerouting and scheduled utility coordination, is estimated at $1.2 million.
- Cost of Failure: An emergency failure would involve not just the repair ($500k), but also road damage ($200k), potential damage to the adjacent fiber and electrical lines ($300k), and indirect costs to the hospital and local businesses due to the disruption. The total estimated cost of a failure could easily exceed $2 million, not to mention the immense reputational damage to the city.
To make this tangible, here is a simplified sample of the kind of summary data you might present.
Summary Data for Northwood Water Main Segment WM-1138
| Data Category | Finding | Implication |
|---|---|---|
| Asset Register | The asset is a 1.2 km, 8-inch diameter cast iron main installed in 1965. | The main has exceeded its typical 50-year design life, increasing its replacement priority. |
| Condition | Acoustic inspection data and leak history result in a condition score of 4 out of 5 (where 5 indicates imminent failure). | Prioritize replacement to mitigate the high likelihood of a near-term failure and service disruption. |
| Performance | This main has experienced 3 breaks in the past 24 months, leading to customer complaints about low pressure and discoloration. | Address the escalating failure rate to improve service reliability and customer satisfaction. |
| Geospatial | The main runs under a major arterial road and is the primary supply for the City General Hospital. | Failure would critically impact public health services and cause significant traffic disruption; avoid this high-consequence scenario. |
| Financial | Proactive replacement is estimated at $1.2M, while the estimated cost of an emergency failure repair is over $2.5M. | Execute proactive replacement as it is the most financially prudent option and avoids a major unbudgeted expense. |
Armed with this integrated dataset, your decision is no longer a guess. You can confidently walk into your director's office and state: "Based on the asset's poor condition, declining performance, high consequence of failure due to its location, and a lifecycle cost analysis that shows proactive replacement is more prudent, I recommend we replace the WM-1138 segment in the next capital budget cycle."
That is a defensible, data-driven decision. That is the work of an asset manager.
Closing
We've journeyed from the simple concept of an asset list to a complex, multi-faceted decision. The key takeaway is that in modern Physical and Infrastructure Asset Management, you cannot manage what you do not measure. Each type of data—Condition, Performance, Financial, and Geospatial—provides a unique lens through which to view your assets. Separately, they are useful. But when integrated and anchored to a comprehensive Asset Register, they become powerful.
The scenario of the Northwood water main illustrates this perfectly. The final recommendation wasn't based on a single data point, but on the combined weight of evidence from all categories. This approach allows you to move beyond reactive repairs and into the realm of strategic asset management, where you can optimize spending, mitigate risks, and ensure that your infrastructure continues to deliver value for the communities you serve. As you move forward in your career, your ability to ask the right questions, gather the relevant data, and weave it into a compelling story for decision-makers will be your greatest asset.
Learning Outcomes
In this reading, you have explored the foundational role of information in asset management. You should now have a practical understanding of how to:
- Explain how distinct data categories like Condition, Performance, Financial, and Geospatial data are used to inform specific asset management decisions, such as maintenance planning, capital investment, and risk mitigation.
- Analyze a given scenario to identify and synthesize the necessary asset information required to make a defensible and effective decision.
You have also been introduced to the core concepts and vocabulary essential to this process, including the central importance of the Asset Register and the specific roles of Condition Data, Performance Data, Financial Data, and Geospatial Data.
Assess Yourself
Take a few moments to check your understanding of the key concepts from this reading. This short quiz will help you gauge your ability to connect data types to real-world asset management problems.
❓ Knowledge Check
Test your understanding of the key concepts from this section.
Next Steps
You have successfully completed this guide to using asset information. This foundational knowledge is something you will build upon throughout your career. Please navigate back to the course to continue with your next activity.
