
Introduction
Imagine you are the asset manager for a major port authority. You're responsible for everything from the cranes that unload container ships to the pavement on the access roads and the navigational beacons guiding ships into the harbor. Your budget, like every budget, is finite. This morning, your maintenance supervisor reported advanced corrosion on a secondary berthing pier, while a separate report from the IT department flagged the aging control system for the main container cranes as a cybersecurity vulnerability.
Both are problems. Both pose a risk. But which one do you address first? How do you justify your decision to the Chief Financial Officer?
This is the daily reality of physical and infrastructure asset management. It's a constant exercise in prioritization. You can't fix everything at once, so you must focus on the things that matter most. This is where risk assessment becomes one of the most critical tools in your professional toolkit. It provides a structured way to understand and compare different problems, allowing you to make defensible decisions that protect your organization's value and mission. In this reading, we'll explore the two fundamental approaches to this challenge: the broad-stroke overview of qualitative analysis and the deep, data-driven dive of quantitative analysis.
The Foundation of Decision-Making: Risk Assessment
Before we compare the two methods, we need a firm grasp of the core concept. In asset management, Risk Assessment is not about trying to create a world with zero risk—that’s an impossible goal. Instead, it's about understanding the risks you face so you can manage them intelligently. At its heart, every risk can be broken down into two fundamental components.
The Two Pillars of Risk: Likelihood and Consequence
Think of risk as a two-sided coin. On one side, you have the chance of something happening. On the other, you have the impact if it does.
-
Likelihood: This is the probability or frequency of a potential failure or event occurring. Are we talking about something that might happen once in a century, or something that happens every other year? To determine this, you might look at historical maintenance records, manufacturer's specifications for mean time between failures (MTBF), or the condition assessment of the asset. For a pipeline in corrosive soil, the Likelihood of a leak increases as it ages.
-
Consequence: This is the impact or severity of the event if it occurs. What happens if that pipeline leaks? A small leak in a rural field has a very different outcome than a major rupture under a critical highway during rush hour. Consequence can be measured in many ways: financial costs (repairs, fines, lost revenue), safety impacts (injuries or fatalities), environmental damage, or reputational harm.
Risk is a Combination
A common mistake is to confuse a high-likelihood event with a high-risk one. A pump seal that fails every six months (high likelihood) but is cheap and easy to replace during planned downtime (low consequence) may be a lower overall risk than a catastrophic bridge support failure that is extremely rare (low likelihood) but would be devastating (high consequence). Risk is always a function of both likelihood and consequence.
With these two pillars in mind, let's look at the first method we use to evaluate them.
Qualitative Risk Analysis: The 30,000-Foot View
Imagine you've just taken over a portfolio of 500 bridges. You need to get a handle on your overall risk profile quickly. You don't have time to do a detailed engineering study on every single one. This is the perfect scenario for Qualitative Risk Analysis.
This approach uses descriptive scales and expert judgment to prioritize risks. It's fast, efficient, and a fantastic way to perform an initial screening across a large portfolio of assets. Instead of calculating that a failure has a 4.7% chance of occurring, you and your team of engineers might classify the likelihood as "Possible." Instead of calculating the financial impact to be $1,245,000, you might classify the consequence as "Major."
The Workhorse Tool: The Risk Matrix
The most common tool for qualitative analysis is the Risk Matrix. It’s a simple grid that allows you to plot your risks visually.
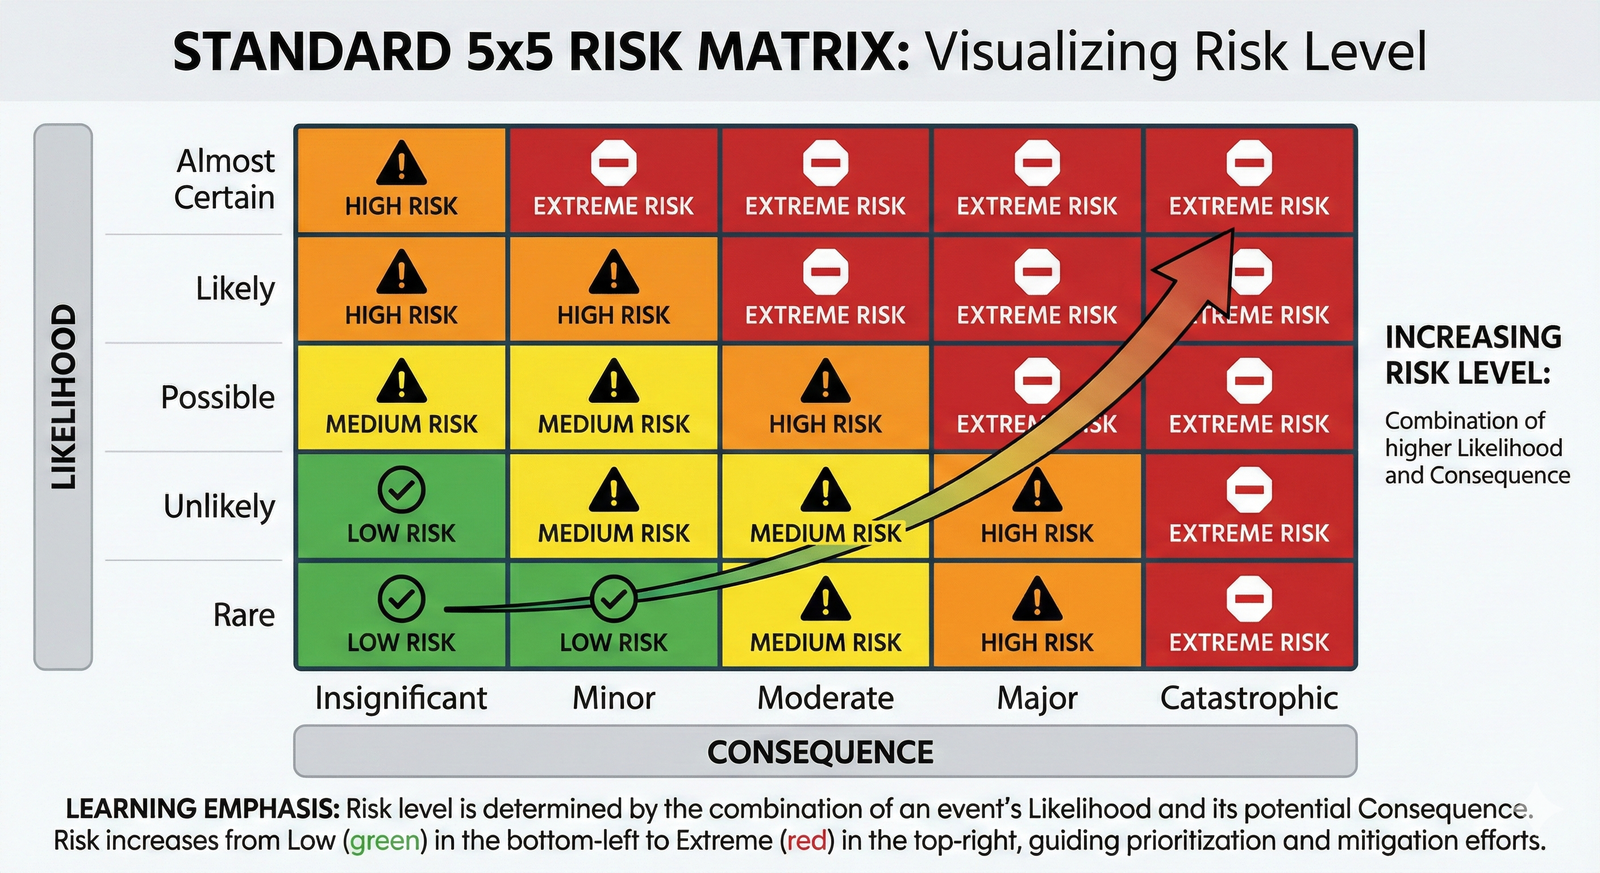
To use it, your team would discuss each potential risk—say, "Deck Pothole Formation" on a specific bridge. 1. Assess Likelihood: Based on inspection reports, traffic volume, and climate, you might rate the likelihood as "Likely." 2. Assess Consequence: A pothole could cause vehicle damage or a minor accident. You rate the consequence as "Minor." 3. Plot the Risk: You find the cell where "Likely" and "Minor" intersect. On most matrices, this would fall into a yellow or medium-risk zone.
You repeat this for all identified risks on all your assets. After a few workshop sessions, you have a visual map of your entire risk landscape. The risks clustered in the red, "high-risk" corner are the ones that demand your immediate attention.
Strengths and Weaknesses of Qualitative Analysis
Strengths: It's fast, cost-effective, and great for engaging a wide range of stakeholders. It doesn't require complex data, relying instead on collective expertise. It's excellent for initial screening of many risks.
Weaknesses: It's subjective. Two different teams might rate the same risk differently. The scales ('High', 'Medium', 'Low') are imprecise and can hide significant variations within a single category. It's difficult to use for cost-benefit analysis.
Quantitative Risk Analysis: The Microscope
Now, let's go back to your risk matrix. You've identified three risks in the "Extreme" category: 1. Corrosion on the main suspension cables of your city's landmark bridge. 2. Potential failure of the primary transformer at the regional airport. 3. Seismic vulnerability of a major water aqueduct.
All are "Extreme," but you only have the budget to launch one major capital project this year. How do you choose? This is where you need to go beyond descriptive labels and get into the numbers. This is the domain of Quantitative Risk Analysis.
This method replaces subjective scales with hard data. It aims to answer the question, "What is this risk costing us, in real terms?"
Gathering the Data
To perform a quantitative analysis, you need data. This is its biggest challenge and its greatest strength. For the failing airport transformer, you would need to gather information like:
- Asset Value: What is the replacement cost of the transformer? Let's say $2 million.
- Failure Probability: Based on its age, condition, and manufacturer data, your engineers calculate a 10% chance of failure in the next year.
- Direct Costs: What would it cost to repair? This includes labor, equipment, and the new parts.
- Indirect Costs: This is the crucial part. What is the financial impact of an airport-wide power outage?
- Lost landing fees from diverted flights.
- Penalties to airlines for delays.
- Cost of emergency power generation.
- Damage to the airport's reputation.

Calculating the Financial Impact
With this data, you can start to put a dollar value on the risk. A common metric is the Annualized Loss Expectancy (ALE). While the exact formula can get complex, the basic concept is:
ALE = Single Loss Expectancy (SLE) x Annualized Rate of Occurrence (ARO)
- Single Loss Expectancy (SLE): The total financial loss if the event happens once. (e.g., $2M replacement + $3M in indirect costs = $5M SLE).
- Annualized Rate of Occurrence (ARO): The probability of it happening in a given year (e.g., 10% or 0.1).
In this simplified case, the ALE for the transformer risk is $5,000,000 * 0.1 = $500,000. This means the organization is effectively losing $500,000 in value per year by accepting this risk.
Now you can perform the same analysis for the bridge cables and the aqueduct. The results might look like this: * Transformer Risk: ALE = $500,000 * Bridge Cable Risk: ALE = $1,200,000 * Aqueduct Seismic Risk: ALE = $850,000
The decision is now much clearer. The bridge cable risk, expressed in financial terms, is more than double the transformer risk. This gives you a powerful, data-backed argument to present to the CFO for prioritizing the bridge project.
📊 View Diagram: Integrated Risk Analysis Workflow
Choosing the Right Tool for the Job
As the workflow diagram shows, the two methods are not competitors; they are partners. You don't use a microscope to scan the horizon, and you don't use binoculars to inspect a cell.
-
Use Qualitative Analysis when:
- You are screening a large number of risks.
- You need results quickly and cost-effectively.
- You have limited access to specific failure data.
- You are facilitating a high-level discussion with a diverse group of stakeholders.
-
Use Quantitative Analysis when:
- You are comparing a small number of high-consequence risks.
- You need to justify a significant capital investment.
- You are choosing between different mitigation strategies and need to perform a cost-benefit analysis.
- You have access to reliable historical, financial, and operational data.
The Future is Hybrid
The evolution of asset management is making this hybrid approach even more powerful. The rise of the Internet of Things (IoT) and predictive analytics is transforming our ability to assess risk. Sensors on a bridge can provide real-time stress data, turning a qualitative "Likely" into a quantitative, data-driven probability of failure. Smart meters on a water network can pinpoint the financial impact of leaks with incredible precision. This infusion of data enhances both methods, allowing for faster, more accurate qualitative sorting and providing the rich data needed for robust quantitative models. The core principles of likelihood and consequence remain, but our ability to measure them is becoming more sophisticated every day.
Closing
Returning to our port authority manager, the path forward is clear. A broad, qualitative analysis of all assets would quickly highlight the corroding pier and the vulnerable crane control system as significant risks. The pier might be rated "High" likelihood and "Major" consequence (structural failure), while the control system might be "Possible" likelihood and "Catastrophic" consequence (port-wide shutdown).
Faced with two very different but severe risks, the manager can now commission targeted, quantitative analyses for each. This deep dive will translate the risks into a common language: money. By comparing the Annualized Loss Expectancy of each, the manager can make a data-driven, defensible decision. This is the power of a structured approach. It moves us from reacting to gut feelings to proactively managing our assets based on a clear understanding of what truly puts our operations, our finances, and our communities at risk. Mastering both qualitative and quantitative analysis is not just a technical skill; it is fundamental to effective leadership in asset management.
Learning Outcomes
In this reading, you have explored the core methods for assessing risk in an asset management context. You can now:
- Differentiate between the rapid, expert-driven approach of qualitative analysis and the data-intensive, financial focus of quantitative analysis.
- Explain how every risk is a product of its likelihood of occurring and the consequence if it does.
- Describe how to use a risk matrix to visually categorize and prioritize a portfolio of risks.
- Identify specific scenarios where a quick qualitative assessment is sufficient, and when a more rigorous, quantitative deep-dive is necessary to justify major decisions.
You have also been introduced to the foundational vocabulary of the field, including Risk Assessment, Qualitative and Quantitative Risk Analysis, Likelihood, Consequence, and the Risk Matrix.
Assess Yourself
Check your understanding of the key concepts from this reading.
❓ Knowledge Check
Test your understanding of the key concepts from this section.
Next Steps
Well done. You have completed this overview of risk analysis methods. This foundational skill is central to making sound decisions in asset management. When you are ready, please navigate back to the course page to continue your learning journey.
