
The Case
The alert on your screen flashes for the third time this morning: "Service Disruption - Route 12." For Metro City Transit (MCT), this means another unscheduled bus breakdown, another group of stranded passengers, and another expensive emergency repair. As the newest Data Analyst on the team, you were hired to help solve this exact problem. The city manager is tired of budget overruns and angry citizen emails.
Your new boss is Anya Sharma, the Head of Fleet Maintenance. Anya is a legend at MCT, with 20 years of experience keeping the city's aging fleet on the road. She trusts her gut and the instincts of her veteran mechanics far more than any spreadsheet. She sees the breakdowns as an unavoidable cost of doing business with older vehicles and is skeptical that your data models can tell her anything her team doesn't already know.
"The city manager wants us to be 'data-driven'," she told you yesterday, her skepticism barely concealed. "He thinks a computer can predict when a 12-year-old bus is going to have its transmission fail. I think that's wishful thinking." The fleet is a mix of diesel, hybrid, and a few new electric buses, and the problems seem to pop up everywhere.
To prove her point, she's given you a challenge. She's forwarded you a raw data dump from the fleet management system, containing a mix of operational stats and maintenance logs from the past few years. "Here's the data you wanted," her email read. "It's messy. It's probably incomplete. See if you can find anything in there that will actually help us stop a breakdown before it happens. Show me something that can help my team decide which bus to bring in for service on Monday morning."
This is your first major project and your chance to demonstrate the value of a predictive approach. The data is in your hands. Your task is to turn this jumble of numbers into a clear, actionable strategy that can win over a skeptical expert and get MCT's buses running on time.
Resources and Data
Anya has provided you with the following files to begin your analysis. You'll need to examine them carefully to formulate your plan.
Key Document: Email: Here's the data you asked for
Metro City Transit - Fleet Data (2020-2023)
| Bus ID | Age Years | Mileage | Last Service Date | Engine Temp Avg | Oil Pressure Avg | Vibration Level | Fuel Type | Major Failure Next 30 Days |
|---|---|---|---|---|---|---|---|---|
| MTA-7811 | 12 | 482105 | 2022-11-20 | 102.5 | 38.2 | 1.85 | Diesel | 1 |
| MTA-8204 | 8 | 315678 | 2023-01-15 | 99.8 | 45.1 | 1.22 | Diesel | 0 |
| MTA-6559 | 14 | 598432 | 2022-10-05 | 104.1 | -55.0 | 2.15 | Diesel | 1 |
| MTA-9130 | 5 | 198750 | 2023-03-22 | None | 52.8 | 0.76 | Hybrid | 0 |
| MTA-E101 | 2 | 65430 | 2023-05-10 | None | None | 0.25 | Electric | 0 |
| MTA-7902 | 11 | 450111 | 2023-01-08 | 101.9 | 41.5 | 1.67 | Diesel | 0 |
| MTA-8845 | 6 | 240500 | 2023-04-01 | 98.2 | 5230.1 | 0.95 | Hybrid | 0 |
| MTA-6988 | 13 | 530888 | 2022-12-18 | 105.3 | 36.4 | 2.01 | Diesel | 1 |
| MTA-E108 | 1 | 32100 | 2023-06-01 | None | None | 0.18 | Electric | 0 |
| MTA-9210 | 4 | 150245 | 2023-02-28 | None | 55.6 | 0.65 | Hybrid | 0 |
| MTA-7734 | 12 | 501345 | 2023-01-25 | 103.8 | 37.9 | 1.95 | Diesel | 0 |
| MTA-8150 | 9 | 355480 | 2022-11-30 | 100.5 | -25.8 | 1.45 | Diesel | 1 |
| MTA-9005 | 5 | 210830 | 2023-05-18 | 97.4 | 61.2 | 0.88 | Hybrid | 0 |
| MTA-8521 | 7 | 289123 | 2023-03-10 | 99.1 | 48.7 | 1.1 | Hybrid | 0 |
| MTA-7699 | 13 | 545210 | 2022-09-14 | None | 35.1 | 2.3 | Diesel | 1 |
| MTA-E115 | 3 | 98500 | 2023-04-20 | None | None | 0.45 | Electric | 0 |
Data is Rarely Perfect
Real-world datasets are often incomplete or contain errors. Before any analysis, a critical first step is to inspect the data for missing values, outliers, and inconsistencies. This process, known as data cleansing, is essential for building a reliable model.
Regression Analysis
Your Task
You are the new Data Analyst for Metro City Transit. Your first assignment is to respond to Anya Sharma's challenge. Using the provided narrative and resources, your task is to develop a plan to predict bus maintenance needs. You are not required to build a full statistical model yourself, but you must outline the complete process you would take.
Your final output should be a brief, professional recommendation for Anya that explains your initial findings from the data and proposes a clear path forward. Your goal is to convince her that a data-driven approach is not only possible but valuable for her team.
How to Structure Your Response
A strong analysis follows a clear structure.
- Define the problem: Briefly state the core business problem.
- Identify core issues: Analyze the provided data. What are the immediate issues with the dataset? What initial relationships do you observe?
- Identify possible solutions: Describe the steps you would take to clean the data and perform a regression analysis.
- Recommend a best solution: Propose a clear plan of action and explain how your proposed model will help Anya's team move toward predictive maintenance.
Guiding Questions
Use these questions to help structure your thinking as you analyze the case and prepare your recommendation.
- What is the primary business problem Metro City Transit is facing, according to the narrative?
- After reviewing the
mct-bus-maintenance-historydataset, what specific data quality issues (missing values, errors, outliers) can you identify? - Which variables in the dataset do you hypothesize might be strong predictors of a
Major_Failure_Next_30_Days? Why? - What specific steps would you need to take to clean and prepare this dataset before you could use it for regression analysis?
- In the context of this problem, what is the dependent variable? What are the independent variables?
- If your regression model showed that
Age_YearsandEngine_Temp_Avghave a strong, positive correlation withMajor_Failure_Next_30_Days, how would you explain this finding to Anya Sharma in simple, non-technical terms? - Based on your complete analysis, what is your final recommendation for MCT? What are the immediate next steps you would propose to Anya?
An Expert Response
An Expert's Approach
This is one example of a strong response. Your own analysis might have different points of emphasis or a unique structure. The goal is to apply the core principles of data analysis to the problem, so other excellent responses are possible.
To: Anya Sharma
From: [Your Name], Data Analyst
Subject: Plan for Predictive Maintenance Analysis
Anya,
Thank you for providing the fleet data. After an initial review, I'm confident we can develop a useful tool to help your team prioritize maintenance and prevent breakdowns. Here is a brief outline of my findings and a proposed plan.
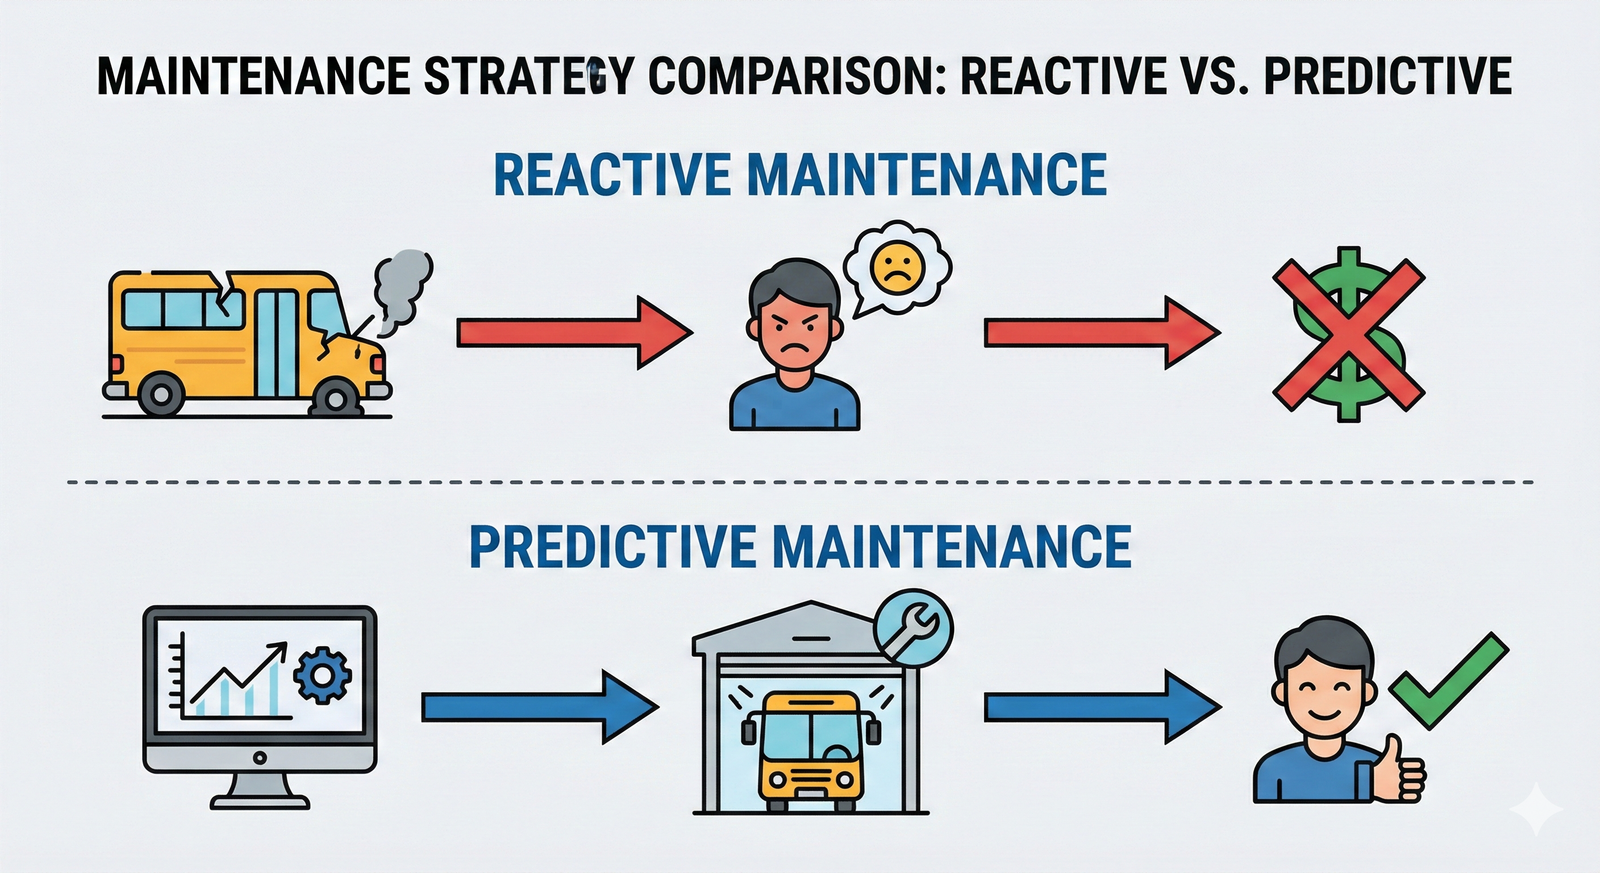
1. The Business Problem MCT is currently in a reactive maintenance mode, leading to service disruptions and high costs. Our goal is to shift to a predictive model, using data to identify at-risk buses for proactive service.
2. Initial Data Analysis & Core Issues
The historical dataset is a great starting point. My initial review confirms your suspicion that the data is "messy." Specifically:
* The Engine_Temp_Avg column has several missing entries.
* The Oil_Pressure_Avg column contains impossible data points, including negative values and extreme outliers.
These data quality issues are common and must be resolved before we can build a reliable model.
3. Proposed Process: From Raw Data to Actionable Insights
I propose a four-step process:
* Step 1: Data Cleansing. I will address the data quality issues. Missing temperature data can be filled using an average for that bus model (imputation). The erroneous oil pressure data points will be corrected or removed so they don't skew the results.
* Step 2: Exploratory Analysis. I will visualize the cleaned data to identify trends. For example, creating scatter plots to see if there's a visual link between bus age and failures.
* Step 3: Model Building. I will use logistic regression to model the relationship between operational data (age, mileage, temp, etc.) and the likelihood of a major failure. This is the right technique because our target—Major_Failure_Next_30_Days—is a "yes/no" outcome.
* Step 4: Interpretation. The model will produce a "risk score" for each bus. It will tell us how much each factor, like an extra year of age or a 5-degree increase in temperature, raises the probability of a failure.
4. Recommendation & Next Steps I recommend we proceed with this plan as a pilot project. The outcome will not be a magic box that replaces your mechanics' expertise. Instead, it will be a "Bus Risk List" that we can give your team every week. This list will rank every bus in the fleet by its probability of failure.
Your team can then use their deep knowledge to focus their attention on the top 5 or 10 buses on that list, using this tool to guide their expert inspections. This approach combines the power of data with the invaluable experience of your team to catch problems before they happen.
I am ready to begin the data cleansing process immediately and can provide a preliminary risk list for a subset of the fleet within a week.
Assess Yourself
Reflect on Your Analysis
Use the following criteria to evaluate your own response to the task. Consider where your analysis was strongest and where you could provide more detail or a clearer rationale.
- Problem Identification: You clearly and concisely stated the core business problem facing Metro City Transit.
- Data Quality Evaluation (piam-630-cc-3): You successfully identified the specific errors and missing values in the provided dataset.
- Analysis Plan (piam-630-cc-3): You outlined a logical, step-by-step process for cleaning the data and preparing it for analysis.
- Methodology Selection (piam-630-s-6): You correctly identified regression analysis (specifically, logistic regression) as the appropriate method for this predictive task.
- Interpretation of Results (piam-630-s-7): You demonstrated an ability to explain what the potential results of the model would mean in practical, business-oriented terms.
- Recommendation & Rationale: Your final recommendation is actionable, directly addresses the problem, and is justified by your analysis.
Learning Progress
By working through this case, you have practiced the essential skills of a data-driven asset manager. You evaluated a raw dataset for quality issues, outlined the steps for conducting a regression analysis, and considered how you would interpret the model's results to make a concrete business recommendation.
Next Steps
Excellent work applying your analytical skills to this real-world challenge. You've successfully outlined a plan to move Metro City Transit toward a more predictive, efficient maintenance strategy. Please navigate back to the course to continue your learning journey.