
Introduction
Have you ever stood in front of a critical piece of equipment, a maintenance report in hand, and realized the data you're relying on just doesn't make sense? Maybe the last service date is in the future, or the part number listed doesn't exist. This isn't just an administrative headache; it's a scenario that plays out every day in facilities and infrastructure networks around the world. The quality of your data directly impacts your ability to make sound decisions, predict failures, and manage budgets effectively.
In the world of physical and infrastructure asset management, we often say, "Garbage in, garbage out." But it's more serious than that. "Garbage in" can lead to "catastrophe out." A faulty sensor reading that goes uncorrected could lead to a catastrophic pump failure. An incomplete maintenance history could result in a bridge inspection being missed. Poor data isn't an IT problem; it's an operational risk. This reading is your first step toward becoming a practitioner who not only understands this risk but knows how to control it. We'll move beyond the abstract and into the practical, exploring what defines "good" data and how you can systematically find and fix the "bad" data before it causes real-world problems.
The Foundation: What is Data Quality?
Before we can fix a problem, we have to agree on what it is. In our field, Data Quality is the bedrock of a successful asset management strategy. Think of it like the material specifications for a construction project. You wouldn't accept a shipment of concrete that hasn't been tested and verified to meet specific strength standards. Similarly, you shouldn't accept asset data into your systems without verifying its quality. Low-quality data erodes trust in your systems, leads to inefficient work, and can have severe financial and safety consequences. High-quality data, on the other hand, empowers predictive maintenance, optimizes capital spending, and builds a resilient and reliable infrastructure portfolio.
The Six Dimensions of High-Quality Data
To move from a vague feeling that "the data is bad" to a specific, actionable plan, we need a framework. The most effective way to evaluate data quality is by assessing it against several key dimensions. While different models exist, most agree on a core set of characteristics.
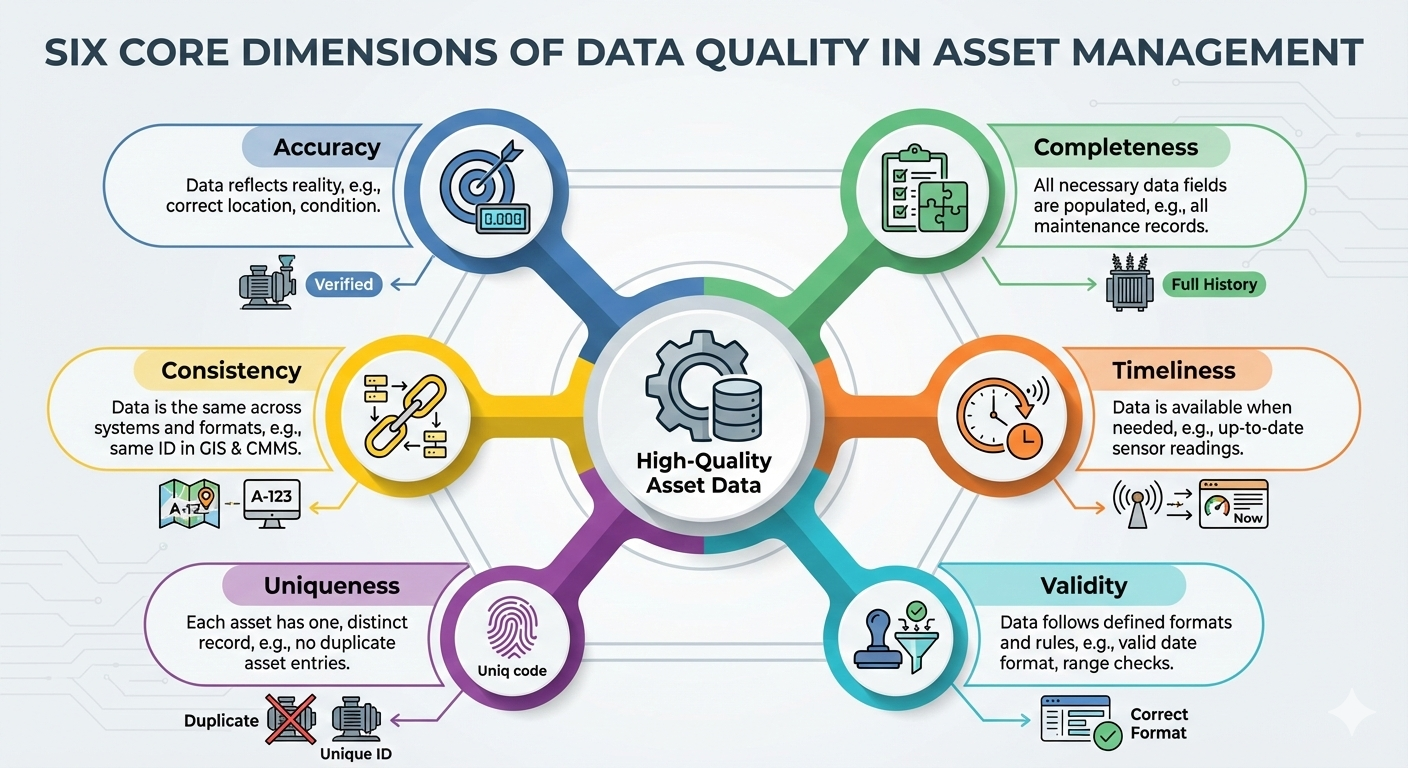
1. Accuracy: Does the data correctly reflect the real-world object or event? If your asset register says a pump is a Model-XJ7, but the nameplate on the actual pump says it's a Model-XJ9, you have an accuracy problem. This is the most intuitive dimension but often the hardest to verify without physical inspection or cross-referencing with trusted source documents.
2. Completeness: Is all the necessary data present? A maintenance record that’s missing the date of service or the name of the technician who performed the work is incomplete. Completeness is critical for analysis. You can't analyze maintenance trends if half the records are missing the "problem code."
3. Consistency: Does the same data stored in different locations match? If your Computerized Maintenance Management System (CMMS) lists an asset's installation date as 2015, but your financial system lists it as 2016, you have an inconsistency. This often points to data silos and a lack of a single "source of truth."
4. Timeliness: Is the data available when it's needed? A sensor that reports a critical pressure drop an hour after it happens is not timely. In our world, delays aren't just inconvenient; they can eliminate your window to prevent a failure. Data must be fresh enough to be relevant for the decision at hand.
5. Uniqueness: Is this the only record for this specific asset or event? Duplicate records are a common plague. Having two different asset IDs for the exact same motor splits its maintenance history, making it impossible to get a true picture of its cost and reliability.
6. Validity: Does the data conform to a defined format, type, or range? A date field that contains the text "last Tuesday" is invalid. A pressure reading that is negative is likely invalid. This is often the first line of defense and can be enforced with proper database design and data entry rules.
Dimensions are Interrelated
These dimensions are not independent silos. An invalid date format (Validity issue) can lead to an inability to calculate asset age (Completeness issue for analysis), which in turn could cause an inaccurate lifecycle cost calculation (Accuracy issue).
Spotting the Problems: Identifying Data Quality Issues
You can't fix what you can't find. The first active step in improving data quality is profiling your data to uncover the issues. This involves using analytical and statistical methods to examine your datasets and identify anomalies that point to quality problems. Two of the most common culprits you'll be hunting for are missing values and outliers.
The Case of the Missing Values
Imagine you're trying to calculate the average time between failures for a set of critical pumps. You pull 100 maintenance records, but 30 of them are missing the "Date of Failure." Your calculation will be based on an incomplete picture and therefore inaccurate. These gaps are known as Missing Values.
Finding them is usually straightforward. Most software tools can generate a report showing the percentage of missing data for each column in your dataset. The real challenge is understanding why the data is missing. Is it random, or is there a systematic reason? For example, if "Failure Code" is always missing for one specific plant, it might indicate a training issue or a problem with how data is collected at that site.
The Trouble with Outliers
An Outlier is a data point that lies an abnormal distance from other values in a random sample from a population. In a maintenance context, you might have 50 work orders for a specific task that average 2 hours to complete, but one record shows 200 hours. Is this a typo (it should have been 2.0 or 20)? Or did a truly exceptional event occur that required a massive amount of time?
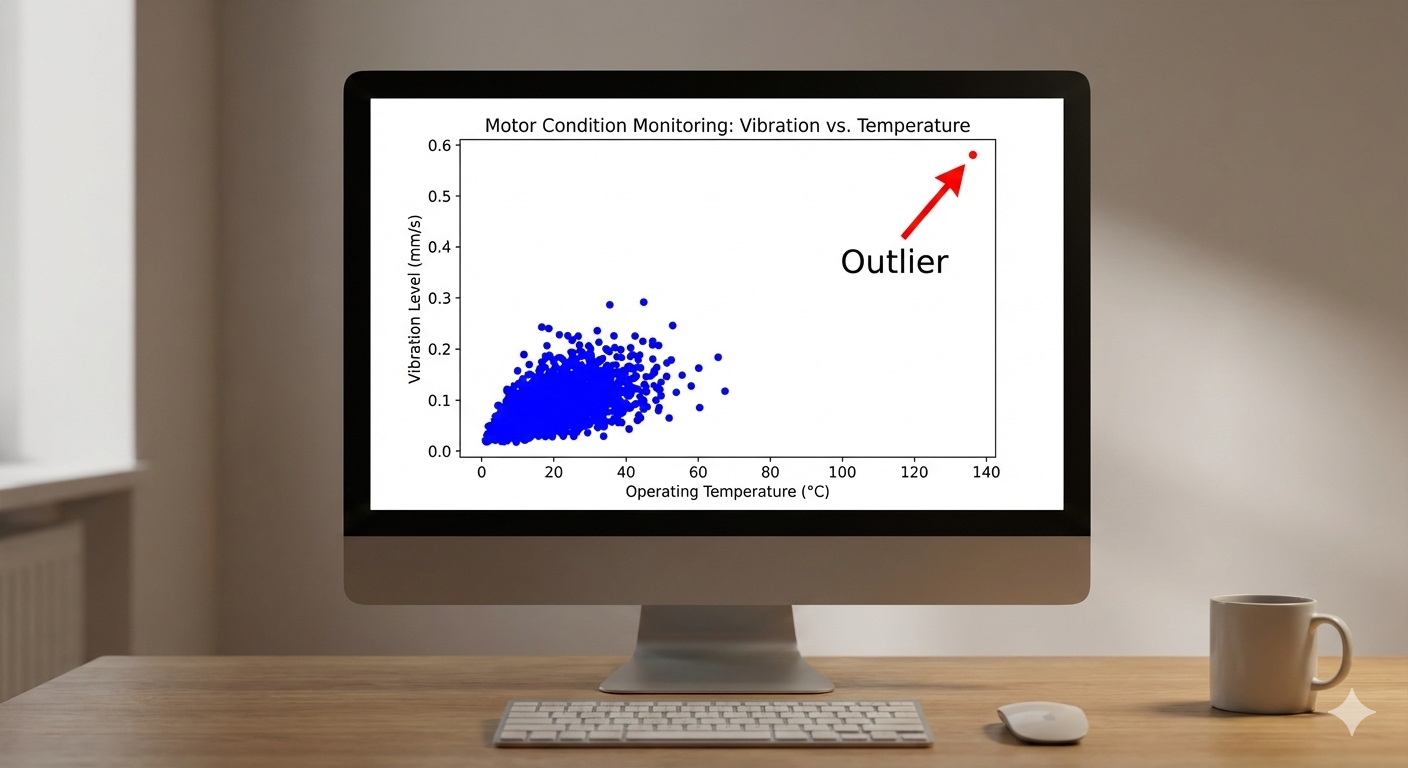
Outliers can dramatically skew statistical analyses. That one 200-hour work order would inflate the average completion time, leading you to budget incorrectly for future work. Identifying them often involves visualization (like scatter plots or box plots) or statistical tests that flag observations falling outside a certain range (e.g., more than 3 standard deviations from the mean).
The Clean-Up Crew: An Introduction to Data Cleansing
Once you've identified the problems, it's time to fix them. This systematic process of detecting and correcting (or removing) corrupt or inaccurate records from a dataset is called Data Cleansing. This isn't about randomly deleting rows in a spreadsheet; it's a deliberate set of techniques applied to improve the quality of your data.
📊 View Diagram: A Simple Data Cleansing Workflow
Practical Data Cleansing Techniques
Let's get our hands dirty. How do you actually deal with the missing values and outliers you've found? You have several options, and the right choice depends on the context.
Handling Missing Values
Here is a sample dataset representing a few maintenance records for a fleet of vehicles. Notice the gaps.
Sample Vehicle Maintenance Log
| Vehicle ID | Service Date | Odometer Reading | Cost | Failure Code |
|---|---|---|---|---|
| V-1001 | 2023-05-15 | 24890 | 125.5 | PM-01 |
| V-1002 | 2023-06-20 | None | 475.0 | BRK-03 |
| V-1003 | 2023-07-01 | 60152 | 890.25 | ENG-12 |
| V-1001 | 2023-11-22 | 35112 | None | TIR-01 |
| V-1004 | 2024-01-10 | None | 210.8 | ELC-05 |
| V-1002 | 2024-02-14 | 52341 | 115.0 | PM-01 |
| V-1005 | 2024-03-05 | 95421 | 675.45 | None |
| V-1003 | 2024-04-18 | 72888 | None | EXH-02 |
| V-1006 | 2024-05-21 | None | 1350.0 | TRN-04 |
| V-1001 | 2024-06-30 | 46023 | 310.75 | SUS-07 |
| V-1007 | 2024-07-11 | 15234 | 195.0 | HVAC-01 |
| V-1004 | 2024-07-15 | 39850 | 95.5 | PM-01 |
Looking at the table above, what can we do about the blanks?
-
Deletion:
- Listwise Deletion: If a row has any missing value, you delete the entire row (the entire record). This is easy but can be wasteful. If you lose 30% of your data just to eliminate a few missing
Failure_Codeentries, your analysis will be weaker. - Pairwise Deletion: You only ignore the record when calculating a statistic that requires the missing column. This preserves more data but can be complex to manage.
- Listwise Deletion: If a row has any missing value, you delete the entire row (the entire record). This is easy but can be wasteful. If you lose 30% of your data just to eliminate a few missing
-
Imputation (Filling in the blanks):
- Mean/Median/Mode Imputation: For a missing
Odometer_Reading, you could fill it in with the average (mean) or middle value (median) of all other odometer readings. For a missing categorical value likeFailure_Code, you could use the most frequent one (mode). This is simple but can reduce the natural variance in your data. - Regression Imputation: A more advanced method where you predict the missing value based on other variables. For example, you could predict a missing
Odometer_Readingbased on theService_Dateand the vehicle's past usage patterns.
- Mean/Median/Mode Imputation: For a missing
Imputation is an Educated Guess
When you impute data, you are manufacturing it. Always document your imputation methods. It's often wise to create a new column or flag that indicates which values were originally missing and have been imputed. This maintains transparency in your analysis.
Managing Outliers
What about that 200-hour work order?
- Investigate: The first step is always to investigate. Was it a data entry error? Pull up the original work order if possible. Talk to the technician. You might find it should have been 20.0 hours, and you can simply correct it. This is the best-case scenario.
- Remove: If you confirm the outlier is an error (e.g., a sensor malfunctioned and gave a physically impossible reading) and it cannot be corrected, removing it is often the right choice.
- Transform: If the outlier is a legitimate but extreme value, removing it might be a mistake. It could represent a rare but important event. In these cases, you might use statistical techniques like transformations (e.g., taking the logarithm of the values) to reduce the skewing effect of the outlier without deleting the information entirely.
Beyond Fixing: Building a Data Quality Culture
Data cleansing is often seen as a reactive, one-time fix. But the real goal is to stop the "garbage" from getting in in the first place. This requires a shift from a project (data cleanup) to a program (data governance). It means establishing clear ownership of data, defining standards for data entry, automating validation checks at the point of entry, and training your team on the importance of data quality.
Your role as an asset manager isn't just to analyze the data you're given. It's to be a steward of that data, to question it, to improve it, and to build systems and processes that ensure its quality over the entire lifecycle of your assets.
Closing
We began with a simple premise: the quality of your data dictates the quality of your decisions. Throughout this reading, we've unpacked that idea into a practical framework. You've seen that data quality isn't a single attribute but a composite of dimensions like accuracy, completeness, and timeliness. We've moved from theory to practice, identifying the common culprits of poor data—missing values and outliers—and exploring the techniques used in data cleansing to address them.
Remember that data cleansing is not just a technical exercise for an analyst. It is a core competency for the modern asset management professional. Your ability to evaluate data quality and apply cleansing techniques, as we've discussed, is fundamental to mitigating operational risk, optimizing performance, and building a credible, data-driven strategy for your organization. The goal is not to have "perfect" data—an impossible standard—but to have data that is fit for purpose and to be fully aware of its limitations. This awareness is what separates a good asset manager from a great one.
Learning Outcomes
In this reading, you have explored the foundational concepts of data quality in an asset management context. You are now better equipped to evaluate the fitness of a dataset by assessing it against the six core dimensions of quality. You have also been introduced to practical methods for identifying and correcting common data issues, specifically learning how to apply data cleansing techniques to handle missing values and manage the impact of outliers. This provides you with the initial skills needed to transform raw, imperfect data into a reliable asset for decision-making.
Assess Yourself
Take a few moments to check your understanding of the key concepts from this reading.
❓ Knowledge Check
Test your understanding of the key concepts from this section.
Next Steps
You have successfully completed this reading on the dimensions of data quality. This is a critical skill set for any asset management professional. Please navigate back to the course page to continue with your next activity.
