
Introduction
Imagine you're the asset manager for a regional water utility. You oversee hundreds of pumps, miles of pipeline, and multiple treatment facilities. Your team works hard, the water keeps flowing, and major failures are rare. By all internal measures, you're doing a good job. But are you? How does your maintenance cost per gallon pumped compare to the utility in the next county? Is your team's response time for critical repairs considered world-class or just average? How do you know if "good" is truly "good enough"?
This is where the discipline of asset performance benchmarking comes in. It's the structured process of looking outside your own four walls—or even just outside a single team or facility—to understand how your performance stacks up against others. It’s not about finding fault; it’s about finding opportunities. It’s the tool that transforms asset management from a reactive, "fix-it-when-it-breaks" function into a proactive, strategic driver of business value. This is how you build a compelling case for investment, drive continuous improvement, and demonstrate the value your team delivers to the organization.
Why Benchmark? Beyond Just Keeping the Lights On
At its core, asset management is about balancing cost, risk, and performance. But without external reference points, you're essentially flying blind. You might be cutting costs, but are those cuts inadvertently increasing long-term risk? You might be hitting your performance goals, but what if the industry standard is 20% higher?
Benchmarking is a formal, systematic process for measuring and comparing your organization's performance against a recognized standard. That standard could be an internal department, a direct competitor, or a best-in-class organization from a completely different industry. The goal is simple: to identify gaps in performance and discover the processes and practices that will help you close them.
The Strategic Value of Benchmarking
Effective benchmarking moves your role from operational to strategic. It provides the objective data needed to: - Justify Budgets: Replace 'we think we need' with 'the top quartile performers invest X, and we are at Y.' - Manage Risk: Identify where underperformance might lead to future reliability or safety issues. - Drive Innovation: Uncover novel approaches to maintenance, operations, and capital planning. - Set Realistic Goals: Anchor performance targets in proven, real-world results, not guesswork.
Think about the last time you had to request funding for a major equipment overhaul or a new technology initiative. A request based on "we feel this is necessary" is easily dismissed. A request backed by data showing "organizations like ours that have adopted this technology have 15% lower maintenance costs and 10% higher uptime" is a powerful business case that executives can understand and support.
The Three Lenses of Benchmarking
Not all comparisons are created equal. The type of benchmarking you choose depends entirely on what you want to learn and the data you can access. We can view this through three distinct lenses.
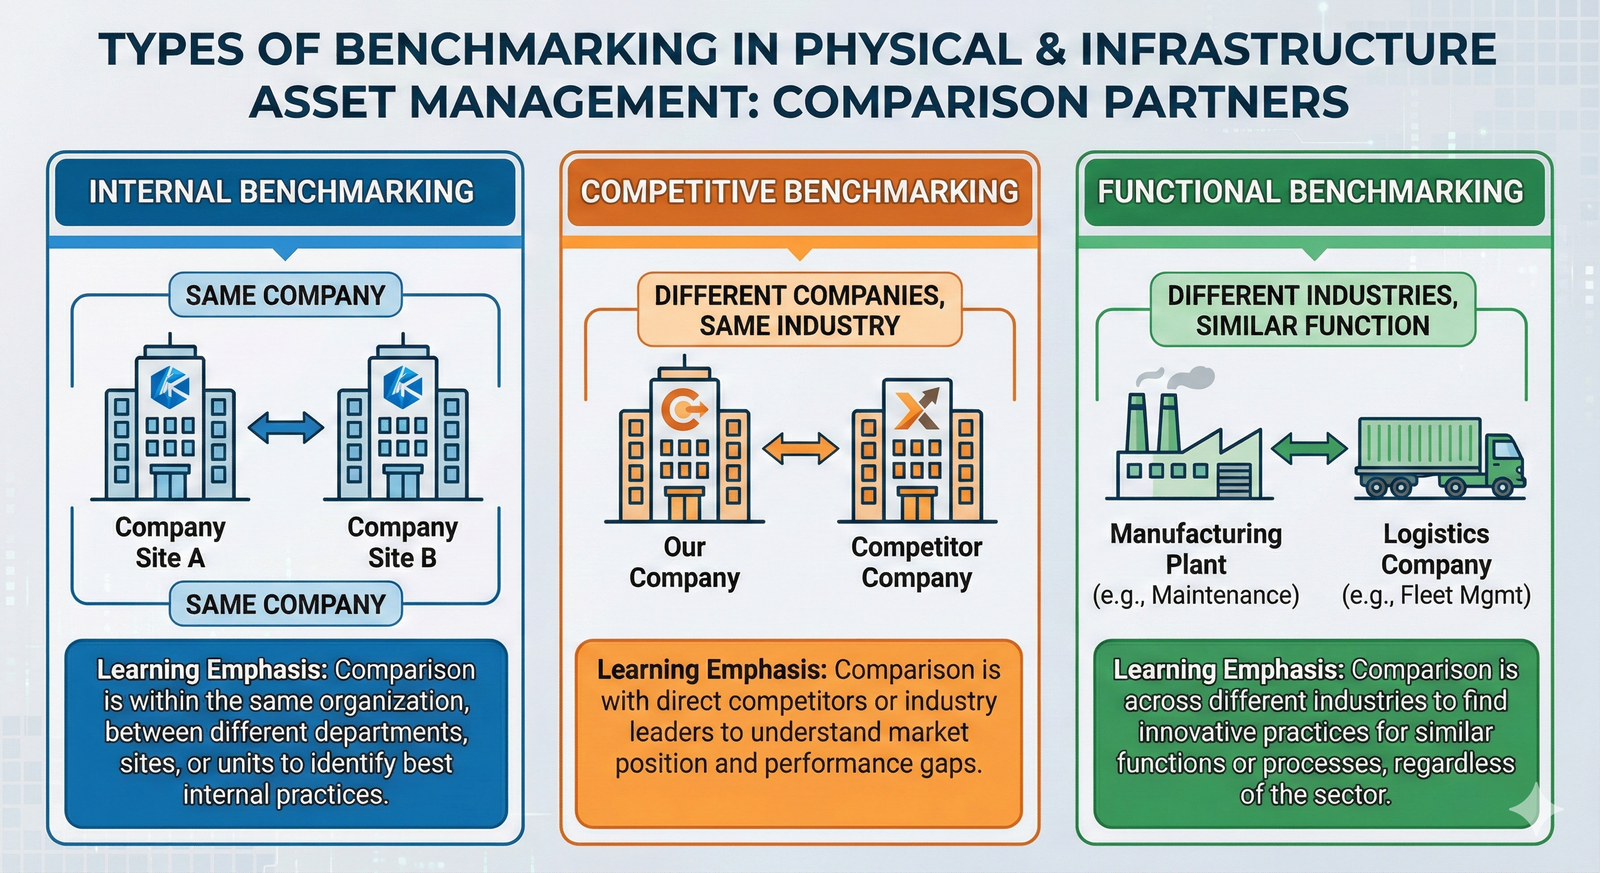
1. Internal Benchmarking This is often the easiest place to start. Internal Benchmarking involves comparing performance between similar assets, teams, or facilities within your own organization. For example, a power generation company might compare the operational efficiency and maintenance costs of its three nearly identical gas turbine plants.
Why is Plant A consistently more reliable than Plant B? Does the maintenance team at Plant C have a unique scheduling process that reduces downtime? This type of benchmarking is powerful because the data is readily available, the context is identical (same corporate culture, same accounting systems), and implementing best practices is often a matter of internal communication and training.
2. Competitive Benchmarking This is the most well-known form. Competitive Benchmarking is the direct comparison of your asset performance metrics against those of your direct competitors. For a municipal water utility, this means comparing your cost per million gallons delivered against other public utilities of a similar size and geography.
The challenge here is data access and confidentiality. Competitors are rarely willing to open their books. This is where industry associations, regulatory bodies, and specialized third-party benchmarking firms play a critical role. They collect, anonymize, and aggregate data, allowing you to see how you stack up against your peers without revealing sensitive information. The insights gained are invaluable for understanding your position in the marketplace.
3. Functional Benchmarking This is where true, out-of-the-box thinking happens. Functional Benchmarking involves looking outside your industry entirely to compare a specific process or function with a recognized "best-in-class" leader. For example, your asset management team might benchmark its spare parts inventory and logistics processes against Amazon's fulfillment centers. Your maintenance scheduling process could be compared to how a major airline schedules its aircraft maintenance.
You aren't comparing pump performance to airplane performance. You are comparing the process of managing a critical inventory or the process of scheduling complex maintenance tasks. This approach can lead to breakthrough improvements by introducing ideas and practices that are completely new to your industry.
The Benchmarking Process: A Step-by-Step Guide
A successful benchmarking initiative is not a weekend project; it's a disciplined management process. While the specifics can vary, most successful projects follow a clear, cyclical path.
📊 View Diagram: The Asset Performance Benchmarking Cycle
-
Plan: This is the most critical phase. You must clearly define what you want to benchmark. Are you looking at the overall reliability of a fleet of vehicles, the cost of maintenance for HVAC systems, or the efficiency of your work order process? Define the specific Key Performance Indicators (KPIs) you will measure. Who are your comparison partners? Who needs to be on the project team? Without a solid plan, you risk boiling the ocean or collecting data that leads nowhere.
-
Collect: This phase is about gathering the numbers. It involves pulling data from your own enterprise asset management (EAM) or computerized maintenance management system (CMMS), and sourcing external data from your chosen benchmarking partners or third-party services. Data quality and consistency are paramount. You must ensure you are comparing apples to apples. For instance, if you're benchmarking maintenance costs, does that include contractor labor, parts, and overhead for both you and your partner?
-
Analyze: With data in hand, the analysis begins. This is where you calculate the metrics and identify the performance gaps between your organization and the benchmark. But it doesn't stop there. The most important question is why the gaps exist. This involves a deeper dive into the underlying processes, technologies, and skills that drive performance. This is the essence of Performance Gap Analysis.
-
Implement: Analysis without action is just an academic exercise. In this phase, you develop an action plan to close the identified gaps. This could involve adopting new maintenance strategies, investing in training for your technicians, upgrading technology, or redesigning a business process. Securing buy-in from stakeholders and assigning clear ownership for the action items is crucial for success.
-
Monitor: Benchmarking is not a one-time event. After implementing changes, you must continuously monitor the KPIs you established in the planning phase to track your progress. This allows you to see if your changes are having the desired effect and helps you recalibrate your approach. This phase feeds directly back into the planning phase for the next cycle of improvement.
From Data to Decisions: Establishing Baselines and Targets
The raw output of a benchmarking study is just data. Its value is realized when you use it to establish a clear understanding of where you are and a clear vision of where you need to go. This involves two key concepts: baselines and targets.
A Baseline is a clearly defined starting point for measuring performance. It's your "You Are Here" map. By analyzing your own historical data, you can establish your current performance level for a given metric. For example, after analyzing a year's worth of data from your CMMS, you might establish that the average uptime for your critical pumps is 98.5%. That is your baseline.
A Target is the specific, measurable goal you aim to achieve. This is where benchmarking data becomes so powerful. Instead of arbitrarily saying, "let's aim for 99% uptime," you can use benchmarking data to set a more strategic target. Perhaps the competitive benchmark shows that the top quartile performers in your industry achieve 99.2% uptime. Now you have a data-driven, defensible target to work toward.
Let's look at a practical example. Below is a simplified dataset for a fleet of five identical water pumps at different stations.
Annual Performance Data for Critical Water Pumps
| Asset ID | Location | Uptime Percentage | Annual Maintenance Cost | Energy Consumption kWh per ML |
|---|---|---|---|---|
| WP-NR-101 | North Ridge Pumping Station | 99.8 | 6200 | 375 |
| WP-SV-305 | South Valley Intake | 86.4 | 28500 | 610 |
| WP-EC-210 | East Creek Booster | 96.5 | 14800 | 460 |
| WP-WT-402 | Westwood Treatment Plant | 92.1 | 19200 | 535 |
| WP-CR-115 | Central Reservoir Hub | 98.9 | 9500 | 405 |
Looking at this data, you can immediately perform an internal benchmark. You can calculate the fleet average for each KPI to establish your overall baseline. You might find that pump WP-004 at North Ridge is the top performer with the highest uptime and lowest costs. The next step is to investigate why. Does the North Ridge team have a better preventative maintenance schedule? Are they using a different type of lubricant? This is the start of a performance gap analysis. If a competitive benchmark then shows that top-quartile utilities have an average energy consumption of 420 kWh/ML, you now have a clear, externally validated target to aim for across your entire fleet.
Navigating the Pitfalls
While the benefits are significant, a poorly executed benchmarking initiative can be a waste of time and resources, or worse, lead to damaging decisions. Being aware of the common pitfalls is the first step to avoiding them.
Common Benchmarking Traps to Avoid
- Comparing Apples to Oranges: Ensure metrics are calculated identically. 'Maintenance Cost' must mean the same thing for everyone. Differences in operational context (e.g., age of assets, operating environment) must be accounted for.
- Poor Data Quality: 'Garbage in, garbage out.' If your own data is inaccurate or incomplete, your baselines will be wrong and your comparisons meaningless.
- Analysis Paralysis: Don't get so lost in the data that you never get to action. The goal is improvement, not a perfect report.
- Lack of Buy-in: If front-line staff and managers see benchmarking as a 'gotcha' exercise, they may resist or even sabotage the effort. Frame it as a collaborative tool for learning and improvement.
One of the biggest mistakes is focusing too much on the numbers and not enough on the processes behind them. Knowing you are in the bottom quartile for reliability is only half the battle. The real value comes from understanding what the top-quartile performers do differently in their planning, execution, and review processes. True benchmarking is a quest for best practices, not just a ranking exercise.
Closing
We began with a simple question: How do you know if "good" is "good enough"? As we've seen, asset performance benchmarking provides the framework to answer that question with confidence. It's a disciplined practice that lifts you above the day-to-day operations and provides a strategic view of your performance.
By understanding the distinction between internal, competitive, and functional benchmarking, you can select the right approach for your specific goals. By following a structured process of planning, collecting, analyzing, implementing, and monitoring, you can turn data into decisions. This process allows you to establish credible performance baselines and set ambitious, yet achievable, targets based on real-world evidence. While there are potential pitfalls, a thoughtful, collaborative approach focused on learning—not just judging—will unlock immense value, helping you optimize cost, mitigate risk, and build a truly world-class asset management program.
Learning Outcomes
In this reading, you have explored the core principles of asset performance benchmarking. You can now:
- Describe the differences between comparing performance within your own organization (internal), against direct competitors (competitive), and against best-in-class organizations from any industry (functional).
- Articulate the strategic benefits of benchmarking, such as justifying budgets and driving innovation, as well as the common traps to avoid, like poor data quality and a lack of stakeholder buy-in.
- List the five key steps in a continuous benchmarking cycle: Plan, Collect, Analyze, Implement, and Monitor.
- Define how to use performance data to establish a baseline (your current state) and how to use benchmarking results to set a meaningful target (your desired future state).
You have also been introduced to the key concepts of Benchmarking, Baselines, Targets, and Performance Gap Analysis.
Assess Yourself
Use this short quiz to check your understanding of the key concepts from this reading.
❓ Knowledge Check
Test your understanding of the key concepts from this section.
Next Steps
Well done on completing this guide to asset performance benchmarking. You've taken a significant step in understanding how to use data to drive strategic improvements.
Please navigate back to the course page to continue your learning journey.
