
Introduction
If you can't measure it, you can't manage it. You've likely heard this phrase before, and in Physical and Infrastructure Asset Management, it's a fundamental truth. But the reality is more nuanced. We are surrounded by data—endless streams of it from sensors, work orders, and financial systems. The real challenge isn't measuring things; it's measuring the right things. How do you cut through the noise to find the signals that truly indicate the health and performance of your assets?
This is where Key Performance Indicators, or KPIs, come in. They are more than just numbers on a dashboard; they are the vital signs of your asset portfolio. A well-designed set of KPIs provides clarity, drives focus, and connects the daily activities of your team to the overarching strategic goals of your organization. In this reading, we'll move beyond the theory and get into the practical craft of designing KPIs that are not just interesting, but genuinely useful for making better decisions about your physical assets.
The Measurement Hierarchy: From Raw Data to Strategic Insight
In any organization, you'll find data everywhere. A sensor on a pump records vibration levels. A maintenance technician logs the hours spent on a repair. The finance department tracks the cost of spare parts. All of this is data, but it isn't all equally useful for strategic decision-making. To make sense of it, we need to understand the hierarchy of measurement.
Step 1: The Foundation of Metrics
At the base of our pyramid is the Metric. A metric is a direct, quantifiable measurement. Think of things like: - Number of safety incidents this month. - Total hours a generator has been running. - Cost of a specific replacement part. - Number of work orders created.
Metrics are essential. They are the raw ingredients. But on their own, they lack context. Is 500 completed work orders good or bad? Without more information, it's just a number.
Step 2: Adding Context with Performance Indicators (PIs)
When you combine a metric with a business context or another metric, you create a Performance Indicator (PI). A PI starts to tell a story. It often takes the form of a ratio, rate, or percentage.
For example, let's take our metrics from before:
- Number of safety incidents / Total work hours gives you an Incident Rate.
- Total downtime hours / Total available hours gives you Availability Percentage.
- Number of planned maintenance work orders / Total number of work orders gives you the Planned Maintenance Percentage.
PIs are a significant step up from raw metrics. They provide context and allow for comparison over time or against benchmarks. You can now see if your incident rate is trending up or down, or how your asset availability compares to a sister facility.
Step 3: Focusing on What's "Key" with KPIs
This brings us to the top of the pyramid: the Key Performance Indicator (KPI). The word "Key" is the most important part of the term. A KPI is not just any PI; it is a PI that is directly and strategically linked to a critical organizational objective. While you might track dozens or even hundreds of PIs, you should only have a handful of true KPIs.
PI vs. KPI: What's the Difference?
Think of it this way: All KPIs are PIs, but not all PIs are KPIs. A Performance Indicator (PI) tells you how you are performing in a specific operational area. A Key Performance Indicator (KPI) tells you how your performance in that area is impacting a critical business goal. If a PI doesn't directly inform a strategic decision, it's not 'Key'.
Imagine your organization's primary goal is to "be the most reliable service provider in the region." A PI like "Planned Maintenance Percentage" is useful, but a KPI might be "Percentage of Customer-Impacting Failures." This KPI directly measures your performance against that specific strategic goal. Every decision, from maintenance scheduling to capital investment, can be viewed through the lens of how it will affect this number.
The Strategic Connection: Aligning KPIs with Goals
The power of a KPI lies in its alignment with organizational strategy. Without this link, you are simply tracking numbers for the sake of tracking numbers. A well-aligned KPI acts as a compass, ensuring that the efforts of your entire team are pointed in the right direction.
This alignment process is often a top-down cascade.
📊 View Diagram: KPI Alignment Cascade
As you can see, the KPI isn't chosen randomly. It's derived directly from the strategic needs of the business. When an asset manager works to improve the MTBF of a critical pump, they aren't just fixing a piece of equipment; they are directly contributing to the organization's profitability. This creates a powerful line of sight from the plant floor to the boardroom.
Characteristics of an Effective KPI: The SMART Framework
So, how do you design a good KPI? A common mistake is to choose indicators that are vague, impossible to measure, or irrelevant to the people who are supposed to act on them. To avoid these pitfalls, we use a framework to test the quality of our proposed KPIs. The most widely recognized is the SMART criteria.
The SMART KPI Framework
An effective KPI must be:
- Specific: Clear and unambiguous. What exactly are you measuring?
- Measurable: Quantifiable. Can you get the data?
- Achievable: Realistic. Is the target you set attainable by the team?
- Relevant: Linked to a strategic objective. Does it matter to the business?
- Time-bound: Tracked over a specific timeframe. By when?
Let's break down a poor KPI and rebuild it using the SMART framework.
Poor KPI: "Improve asset reliability."
- Is it Specific? No. What does "improve" mean? Which assets?
- Is it Measurable? No. How do you measure "reliability" in a single number?
- Is it Achievable? Unclear. Without a specific goal, you can't know.
- Is it Relevant? Probably, but it's too vague to be sure.
- Is it Time-bound? No. There is no deadline.
SMART KPI: "Increase the Mean Time Between Failures (MTBF) for our top 10 critical production assets from 2,500 hours to 3,000 hours by the end of the fiscal year."
- Specific: Yes. It targets MTBF for a defined group of 10 assets.
- Measurable: Yes. MTBF is a standard calculation (Total Uptime / Number of Failures).
- Achievable: Yes. The 20% improvement is a challenging but potentially realistic goal.
- Relevant: Yes. Increasing MTBF for critical assets directly impacts production output and reduces emergency repair costs, linking to goals of productivity and cost control.
- Time-bound: Yes. The deadline is the "end of the fiscal year."
This revised KPI gives the team a clear Target to aim for. Everyone understands what success looks like and how their work contributes to it.
A Balanced View: Leading vs. Lagging Indicators
One of the most powerful concepts in performance measurement is the distinction between leading and lagging indicators. Relying on only one type gives you an incomplete and often reactive view of your asset performance.
A Lagging Indicator is an output measure. It tells you what has already happened. They are historical and easy to measure, but hard to influence. - Number of failures last month - Total repair cost last year - Customer complaints received
A Leading Indicator is an input or process measure. It is predictive and measures activities that are likely to influence future results. They are harder to measure but give you a chance to be proactive. - Percentage of preventive maintenance (PM) tasks completed on time - Percentage of assets with a completed criticality analysis - Number of 'near-miss' safety observations reported
Think of it like driving a car. The lagging indicator is your rear-view mirror; it tells you where you've been. The leading indicator is your windshield; it shows you what's ahead. You need both to navigate effectively.
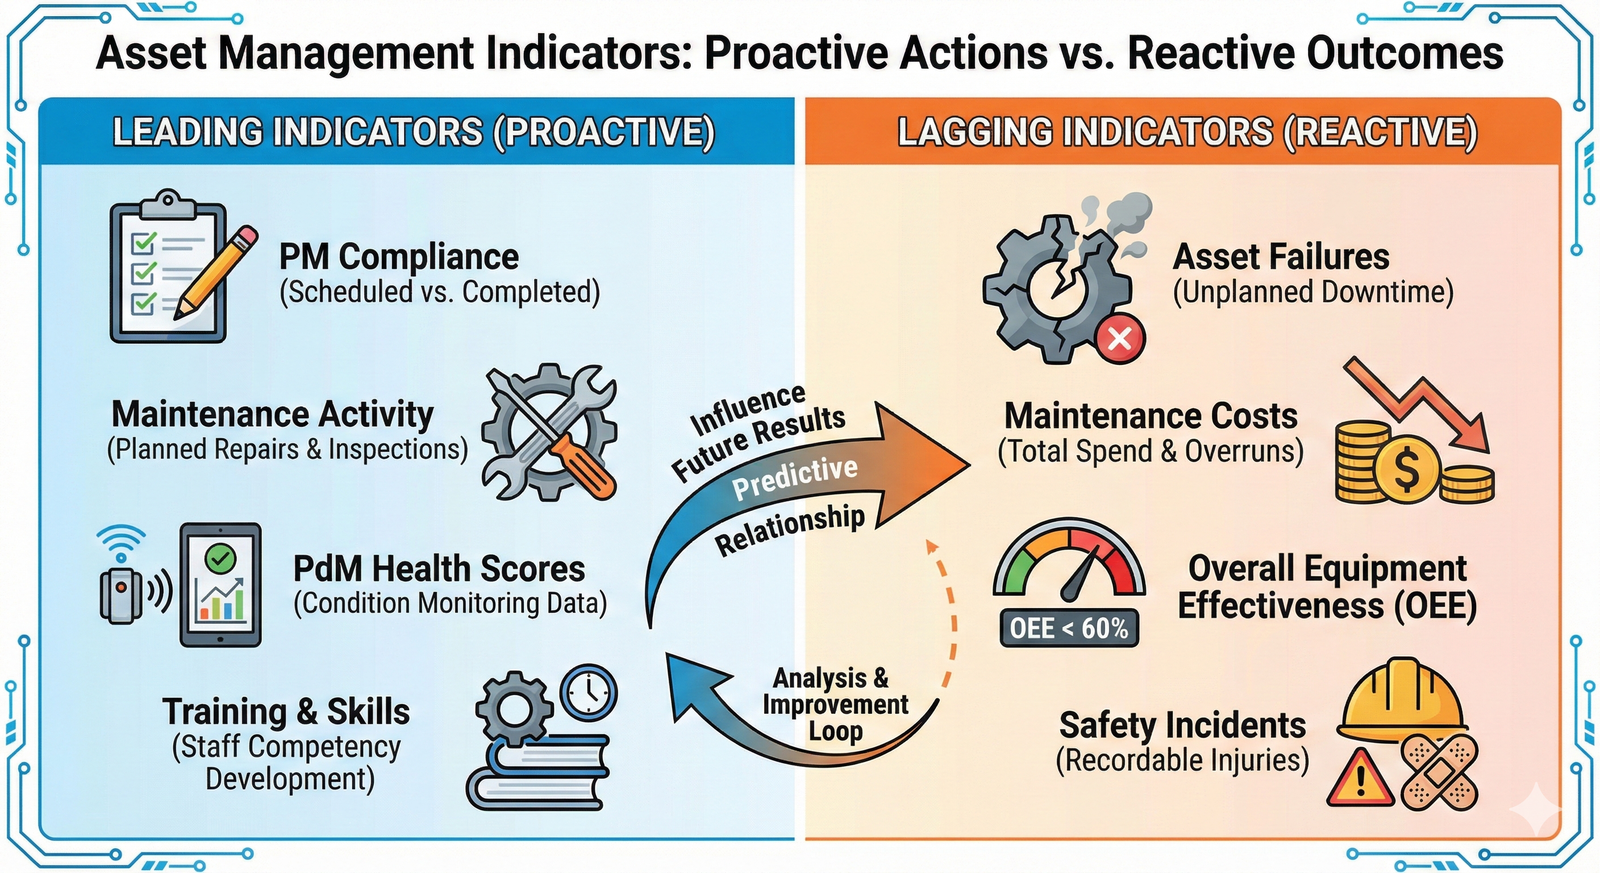
A truly effective asset management program focuses on improving its leading indicators. If you ensure that 98% of your PMs are completed on time (a leading KPI), you can be confident that your number of unplanned failures (a lagging KPI) will decrease in the future. This shifts your team from a reactive "firefighting" mode to a proactive, strategic one.
Putting It All Together: A Practical Example
Let's apply these concepts to a real-world scenario. Imagine you are the Asset Manager for "HydroFlow," a municipal water utility.
Organizational Goal: Ensure a safe, reliable, and cost-effective water supply for the community.
From this, you derive a few key asset management objectives: 1. Maximize the reliability of critical pumping stations. 2. Control maintenance and energy costs. 3. Maintain a safe working environment for all staff.
Now, let's develop a balanced set of KPIs for the "Pumping Stations" asset class.
HydroFlow Pump Station 3 - Monthly Log
| Month | Run Hours | Unplanned Downtime Hours | PM Tasks Completed On Time | PM Tasks Scheduled | Energy Consumption kWh |
|---|---|---|---|---|---|
| January | 742 | 2 | 8 | 8 | 12250 |
| February | 668 | 4 | 7 | 8 | 11900 |
| March | 734 | 10 | 5 | 9 | 12450 |
| April | 708 | 12 | 4 | 9 | 12300 |
| May | 736 | 8 | 7 | 8 | 12150 |
| June | 714 | 6 | 8 | 8 | 12100 |
From the raw data above, we can derive our KPIs:
-
KPI for Reliability (Lagging):
Asset Availability.- Calculation:
(Total Hours in Month - Unplanned_Downtime_Hours) / Total Hours in Month * 100. - SMART Target: Achieve 99.8% availability for Pump Station 3 for the second half of the year.
- Calculation:
-
KPI for Reliability (Leading):
PM Compliance.- Calculation:
(PM_Tasks_Completed_On_Time / PM_Tasks_Scheduled) * 100. - SMART Target: Maintain a PM Compliance rate of >=95% each month.
- Calculation:
-
KPI for Cost Control (Lagging):
Energy Efficiency.- Calculation:
Energy_Consumption_kWh / Run_Hours. - SMART Target: Reduce kWh per run hour by 3% by year-end through operational adjustments.
- Calculation:
By tracking both PM Compliance (leading) and Asset Availability (lagging), the HydroFlow manager can see the connection. When compliance dipped in March, they could predict a potential rise in downtime in the following months and take corrective action, such as reallocating resources to catch up on the maintenance backlog. This is the essence of data-driven asset management.
Closing
We've journeyed from raw data to strategic decision-making, establishing a clear hierarchy from metrics to performance indicators and finally to the Key Performance Indicators that truly matter. Remember, the power of a KPI is not in the number itself, but in its direct, unbreakable link to your organization's strategic goals. A KPI without this alignment is just a vanity metric.
By applying the SMART criteria, you ensure your KPIs are clear, actionable, and relevant to the teams responsible for them. Furthermore, by building a balanced system of both leading and lagging indicators, you equip yourself with both a rear-view mirror and a windshield. You can understand past performance while proactively influencing future outcomes. This approach moves your asset management function from a reactive cost center to a strategic partner in achieving organizational success. The next time you look at a dashboard, don't just see the numbers; see the story they tell about where your organization is going.
Learning Outcomes
In this reading, you have learned how to design and utilize effective Key Performance Indicators for physical asset management. You can now:
- Distinguish between a simple metric (a raw number), a performance indicator (a ratio or rate), and a key performance indicator (a PI tied to a strategic goal).
- Articulate why aligning KPIs with the strategic objectives of your organization is critical for driving focused action and creating value.
- Apply the SMART criteria (Specific, Measurable, Achievable, Relevant, Time-bound) to evaluate and construct robust KPIs.
- Explain the relationship between leading indicators (which are predictive and proactive) and lagging indicators (which measure past results) and why a balance of both is necessary for effective performance management.
You have also been introduced to the core vocabulary of performance measurement, including: - Key Performance Indicators (KPIs) - Leading vs. Lagging Indicators - Metric - Target - SMART criteria
Assess Yourself
❓ Knowledge Check
Test your understanding of the key concepts from this section.
Next Steps
Excellent work completing this reading. You have built a strong foundation for understanding how to measure what matters in asset management.
Please navigate back to the course to continue your learning journey.
