
The Skill
Developing Key Performance Indicators (KPIs) is the process of creating precise, quantifiable measures to track and evaluate the performance of physical assets. This skill involves translating high-level business goals—like improving reliability or reducing costs—into specific metrics that provide a clear view of how well your assets are contributing to those goals.
Effective KPI development moves beyond simple measurement. It requires a deep understanding of operational processes to select metrics that not only report on past performance but also help predict future outcomes. This allows for proactive, data-driven decisions in maintenance, capital planning, and daily operations.
Why Is This Skill Important?
In physical and infrastructure asset management, you cannot manage what you do not measure. KPIs are the instruments on your dashboard; without them, you are flying blind. They provide objective evidence of asset health, efficiency, and financial performance, replacing guesswork with actionable intelligence.
Mastering this skill enables you to justify budgets, prioritize maintenance activities, and demonstrate the value of your asset management program to stakeholders. By linking operational actions directly to strategic objectives, you can focus resources where they will have the greatest impact, ensuring the long-term sustainability and reliability of your organization's physical assets.
Your Task
You are an Asset Management Specialist for the Crestwood Water District. Management has become increasingly concerned about the performance and cost of the district's aging infrastructure. You have been tasked with developing a set of KPIs to help guide a new data-driven asset management strategy.
Your task is to review the internal memo from the Director of Operations and develop a set of 3-4 KPIs that directly address the challenges outlined. For each KPI, you must ensure it follows the SMART framework and classify it as either a leading or a lagging indicator.
Your Process
- Analyze: Carefully read the provided memo to identify the key business objectives.
- Brainstorm: Generate a list of potential metrics that relate to those objectives.
- Formulate: Draft 3-4 SMART KPIs based on your brainstormed metrics.
- Categorize: Classify each of your final KPIs as either a leading or lagging indicator.
Resources and Data
You will use the following internal memo to complete your task. It contains all the context you need to understand the district's current challenges and strategic goals.
Key Document: Internal Memo: Crestwood Water District Asset Performance Review
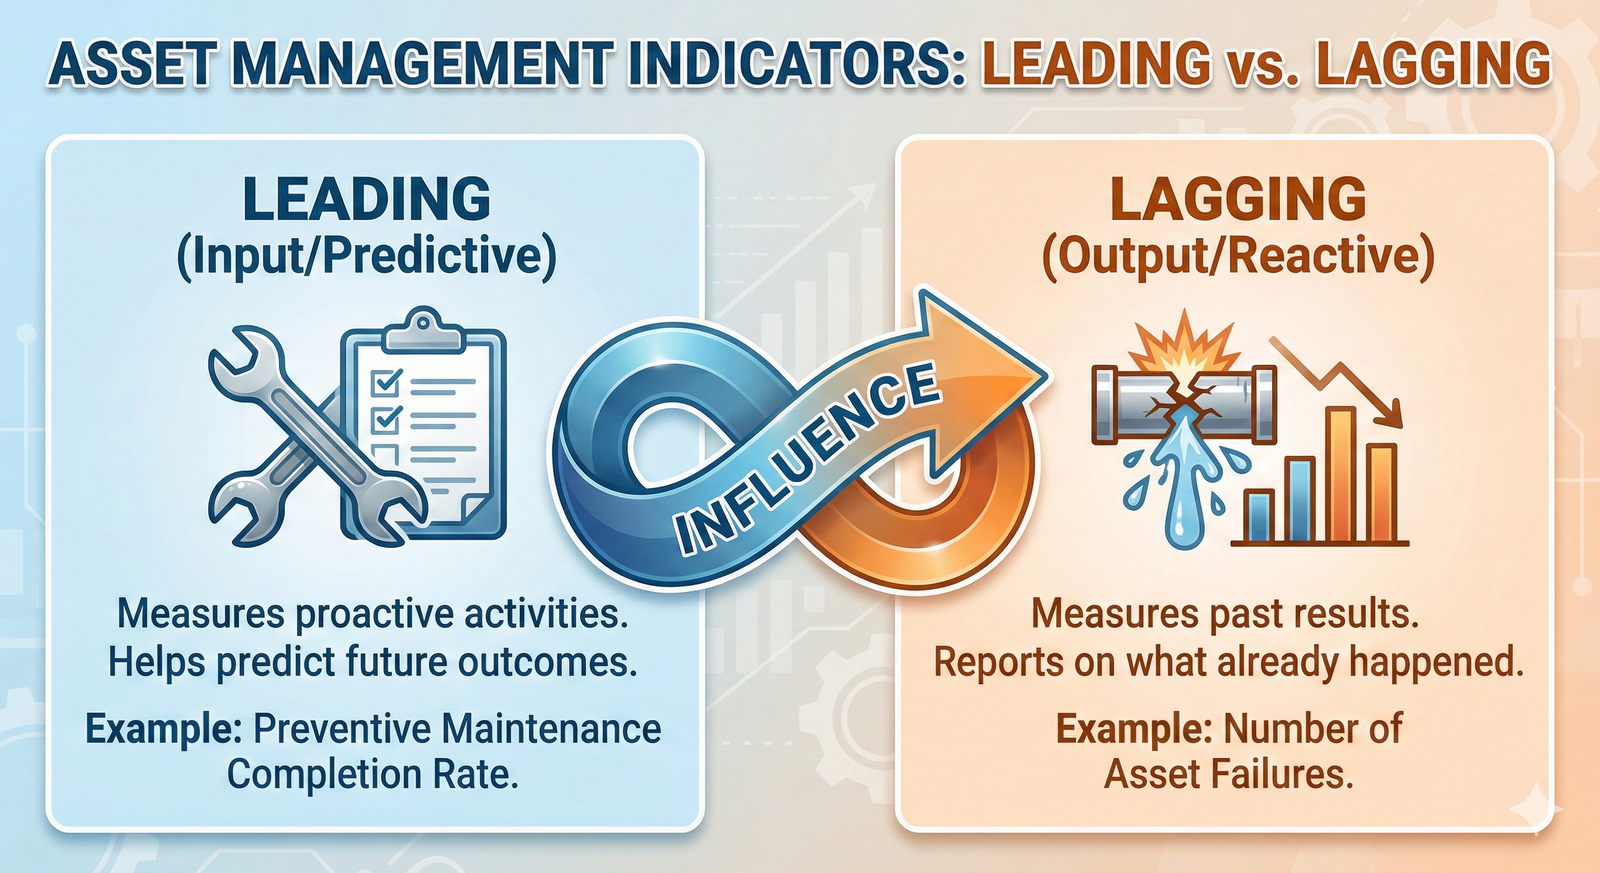
To help you categorize your KPIs, review this overview of leading versus lagging indicators.
Detailed Steps
Follow this step-by-step guide to develop your KPIs.
Step 1: Analyze the Scenario and Identify Objectives
First, read the memo from the Director of Operations carefully. Your goal is to extract the core business problems and translate them into clear objectives. Look for statements that describe desired outcomes or existing pain points.
Key Objectives from the Memo
Based on the memo, the primary objectives for the Crestwood Water District are:
- Improve Reliability: Reduce the frequency of service disruptions caused by asset failures (e.g., water main breaks).
- Control Costs: Reduce unpredictable expenses, particularly overtime labor associated with emergency repairs.
- Shift to Proactive Maintenance: Move from a reactive ('fix-it-when-it-breaks') model to a planned, preventive one.
Step 2: Brainstorm Potential Metrics
With the objectives defined, brainstorm ways to measure progress toward them. At this stage, don't worry about getting the wording perfect. Just list any measurement that seems relevant.
Metric
For example: * Objective: Improve Reliability * Potential Metrics: Number of water main breaks, hours of service downtime, number of customer complaints. * Objective: Control Costs * Potential Metrics: Overtime hours, cost of emergency repairs, budget variance. * Objective: Shift to Proactive Maintenance * Potential Metrics: Number of planned vs. unplanned work orders, percentage of preventive maintenance (PM) tasks completed on time.
Step 3: Formulate SMART KPIs
Now, transform your brainstormed metrics into formal KPIs using the SMART framework. This ensures each KPI is clear, actionable, and directly tied to a goal.
📊 View Diagram: The SMART KPI Framework
Let's apply this to a metric. * Metric: Number of water main breaks. * S (Specific): We will reduce critical water main breaks in the distribution network. * M (Measurable): The memo notes a 30% increase. A good starting point is to reverse that trend. Let's aim for a 15% reduction. * A (Achievable): A 15% reduction is a challenging but realistic goal if new maintenance strategies are implemented. * R (Relevant): This directly addresses the objective of improving reliability and reducing service disruptions. * T (Time-bound): This should be achieved within the next 12 months.
SMART KPI: "Reduce the number of critical water main breaks by 15% within the next 12 months."
Step 4: Categorize KPIs as Leading or Lagging
The final step is to classify each KPI. This is vital for creating a balanced view of performance.
Leading Indicator
Lagging Indicator
- The KPI we just formulated, "Reduce the number of critical water main breaks by 15% within the next 12 months," is a Lagging Indicator. It measures the final outcome.
- A corresponding Leading Indicator would be: "Increase the completion rate of scheduled preventive maintenance on critical water mains from 60% to 90% within 6 months." This tracks the proactive work intended to reduce breaks.
A good set of KPIs includes a mix of both leading and lagging indicators to show not just where you are, but also where you are going.
An Expert Response
A Model for Excellence
This is an example of a strong response. Your own analysis might identify different, equally valid KPIs. The key is to ensure your KPIs are well-reasoned, clearly formulated using the SMART framework, and directly linked to the business objectives in the scenario.
Here is a set of well-defined KPIs for the Crestwood Water District.
1. KPI: Reduce Critical Water Main Breaks * Formulation: Reduce the number of critical water main breaks by 15% (from an average of 10 per month to 8.5 per month) over the next 12 months. * Category: Lagging Indicator. This KPI measures the direct outcome of improved reliability, reporting on what has already happened. It is a direct measure of success in reducing service disruptions.
2. KPI: Increase Preventive Maintenance (PM) Compliance * Formulation: Increase the on-time completion rate of all scheduled preventive maintenance work orders from the current estimated 50% to 90% within 6 months. * Category: Leading Indicator. This KPI measures a proactive process. Improving PM compliance is a key driver that is expected to lead to a future reduction in asset failures and emergency repairs.
3. KPI: Reduce Maintenance Overtime Costs * Formulation: Reduce maintenance overtime labor costs by 25% in the next fiscal year, compared to the previous year's baseline. * Category: Lagging Indicator. This measures a financial outcome that results from other operational changes. It directly tracks progress against the objective of controlling costs.
4. KPI: Reduce Reactive Maintenance Work * Formulation: Decrease the ratio of reactive (emergency) maintenance work orders to planned maintenance work orders from 80/20 to 50/50 within 9 months. * Category: Leading Indicator. This KPI measures the shift in maintenance culture. A falling ratio indicates that planning and proactive work are successfully replacing unplanned, reactive repairs, which will eventually drive down costs and failures.
Assess Yourself
Time to Reflect
Use the following criteria to evaluate your response. How does your work compare to the expert example? Where did you excel, and what could be improved?
- Objective Identification: Did you accurately identify the core business objectives (reliability, cost control, proactive culture) from the provided scenario?
- SMART Formulation: Is each of your KPIs specific, measurable, achievable, relevant, and time-bound? Does it include a clear target and timeframe?
- Relevance to Scenario: Do your chosen KPIs directly address the problems and goals outlined in the Crestwood Water District memo?
- Leading/Lagging Classification: Did you correctly categorize each KPI as either a leading or lagging indicator and understand the difference?
- Balanced View: Did you include a mix of both leading and lagging indicators to provide a complete picture of performance?
Learning Progress
In this activity, you have practiced the essential skill of developing effective KPIs for asset management. You have demonstrated your ability to analyze an operational scenario to identify business objectives, formulate specific and measurable KPIs using the SMART framework, and distinguish between leading and lagging indicators to drive performance.
Next Steps
Excellent work developing these KPIs. This skill is fundamental to implementing a data-driven asset management strategy. Please navigate back to the main course page to continue your learning journey.
