
Introduction
Welcome. If you've ever stood in front of a dashboard full of green lights while knowing, deep down, that your facility's assets could be performing better, you're in the right place. Dashboards are great for a quick status check, but they rarely tell the whole story. They show you the what, but they often hide the why. As an asset manager, your real value isn't just in monitoring performance; it's in understanding and improving it.
This is where we move beyond the surface-level metrics. In this reading, we're going to equip you with two of the most powerful tools in the asset management arsenal: Overall Equipment Effectiveness (OEE) and Root Cause Analysis (RCA). Think of OEE as your diagnostic tool, the high-resolution MRI that tells you exactly where performance is lagging. Think of RCA as the investigative work that follows, the methodical process of digging until you find the foundational issue that needs fixing. Mastering these tools will shift your role from reactive problem-solver to proactive performance driver, a change that is fundamental to a successful career in this field.
The True Meaning of Asset Performance
In any operation, whether it's a water treatment plant, a rail network, or a manufacturing line, your physical assets are there to do a job. The question is, how well are they doing it? This is the essence of Asset Performance. It’s a concept that goes far beyond simple availability. A pump might be running, but if it’s operating at only 60% of its designed flow rate, its performance is poor. A train might be on schedule, but if it requires double the expected maintenance hours to keep it that way, its performance is costing you dearly.
To get a clear, objective picture, we rely on Key Performance Indicators (KPIs). These are the vital signs of your assets. While you might track dozens of metrics, a good KPI is one that is directly linked to an organizational goal, like reducing operational cost or increasing service reliability. This brings us to one of the most important KPIs in the entire field.
Quantifying Performance: An Introduction to OEE
For decades, different departments had their own ways of measuring success. Production focused on output, maintenance focused on uptime, and quality focused on defect rates. The problem? These metrics often conflict. You can maximize Uptime by skipping maintenance, but your output quality and long-term asset health will suffer.
This is the problem that Overall Equipment Effectiveness (OEE) was designed to solve. Developed in Japan as part of the Total Productive Maintenance (TPM) methodology, OEE combines three critical factors into a single, unified score. It provides a universal language for performance that everyone from the plant floor to the executive suite can understand.
The three components of OEE are:
- Availability: This measures the time the asset was actually running versus the time it was scheduled to run. All unplanned and planned stops are considered availability losses.
- Performance: This measures how fast the asset is operating as a percentage of its designed speed or ideal cycle time. Running at a reduced speed is a performance loss.
- Quality: This measures the number of good, sellable units produced as a percentage of the total units started. Units that need to be scrapped or reworked are quality losses.
The OEE calculation is straightforward:
OEE = Availability × Performance × Quality
📊 View Diagram: The OEE Calculation Formula
Let's break this down with an example. Imagine a water bottling line.
- Planned Production Time: 8-hour shift = 480 minutes.
- Breaks: Two 15-minute breaks = 30 minutes.
- So, the actual planned production time is 480 - 30 = 450 minutes.
- **Downtime: The machine jammed twice, for a total of 45 minutes of unplanned downtime.
- Run Time: 450 minutes (planned) - 45 minutes (downtime) = 405 minutes.
1. Availability: * Calculation: Run Time / Planned Production Time = 405 min / 450 min = 90%
Now, let's look at performance. The line is designed to produce 100 bottles per minute (ideal cycle time).
- Total Bottles Produced (including defects): 36,450 bottles.
- Potential Production during Run Time: 405 minutes * 100 bottles/min = 40,500 bottles.
2. Performance: * Calculation: Actual Output / Potential Output = 36,450 / 40,500 = 90% * Why wasn't it 100%? The operators may have run the line slightly slower to avoid jams, a common but hidden loss.
Finally, quality. Out of the 36,450 bottles produced, 729 were rejected for being under-filled or having crooked caps.
- Good Bottles: 36,450 - 729 = 35,721 bottles.
3. Quality: * Calculation: Good Count / Total Count = 35,721 / 36,450 = 98%
Overall OEE: * OEE = 90% (Availability) × 90% (Performance) × 98% (Quality) = 79.4%
Practitioner's Tip: What's a 'Good' OEE Score?
A common question is, 'What OEE should I aim for?' While it varies by industry, here's a general guide:
- 100% OEE: Perfect production (the theoretical ideal).
- 85% OEE: Considered world-class for discrete manufacturing. It's a challenging but achievable goal.
- 60% OEE: A typical score for many companies. It indicates significant room for improvement.
- 40% OEE: A low score, but not uncommon for businesses just starting to track performance. It highlights major opportunities.
Don't get fixated on hitting a universal benchmark. The real power of OEE is in tracking your own score over time and using it to drive improvement.
An OEE of 79.4% might look good on a dashboard, but breaking it down shows us that Availability and Performance losses are our biggest problems. We've identified what is wrong. Now we need to find out why.
From 'What' to 'Why': The Power of Root Cause Analysis
Knowing your OEE score is like a doctor knowing a patient's temperature. A fever of 102°F (39°C) tells you something is wrong, but it doesn't tell you if the cause is a simple cold or a serious infection. Root Cause Analysis (RCA) is the diagnostic process to find that underlying cause. It’s a structured way of thinking that prevents you from falling into the trap of fixing symptoms.
A classic example is a recurring pump failure. * Symptom: Pump P-101 has failed. * Symptom-level fix: Replace the pump. * Problem: The new pump fails again three months later.
Replacing the pump only treated the symptom. A proper RCA pushes you to ask why the pump failed in the first place.
The 5 Whys Technique
One of the simplest and most effective RCA methods is the "5 Whys." It was developed by Sakichi Toyoda, the founder of Toyota Industries, and it's a cornerstone of Toyota's legendary production system. The approach is exactly what it sounds like: you repeatedly ask "Why?" until you get to the root of the problem.
Let's apply it to our 45 minutes of downtime on the bottling line.
Problem: The bottling line was down for 45 minutes.
- Why? Because the main conveyor belt jammed. (This is the immediate technical cause).
- Why did it jam? Because a specific bearing seized. (Getting closer to the physical cause).
- Why did the bearing seize? Because it was not properly lubricated. (Now we're at a human/process level).
- Why was it not properly lubricated? Because the technician responsible for that task was pulled away to handle an "urgent" breakdown on another line. (This reveals a systemic issue).
- Why was the technician pulled away? Because we don't have a clear system for prioritizing maintenance tasks, and the "loudest" problem gets the most attention. (This is the root cause—a management system failure).
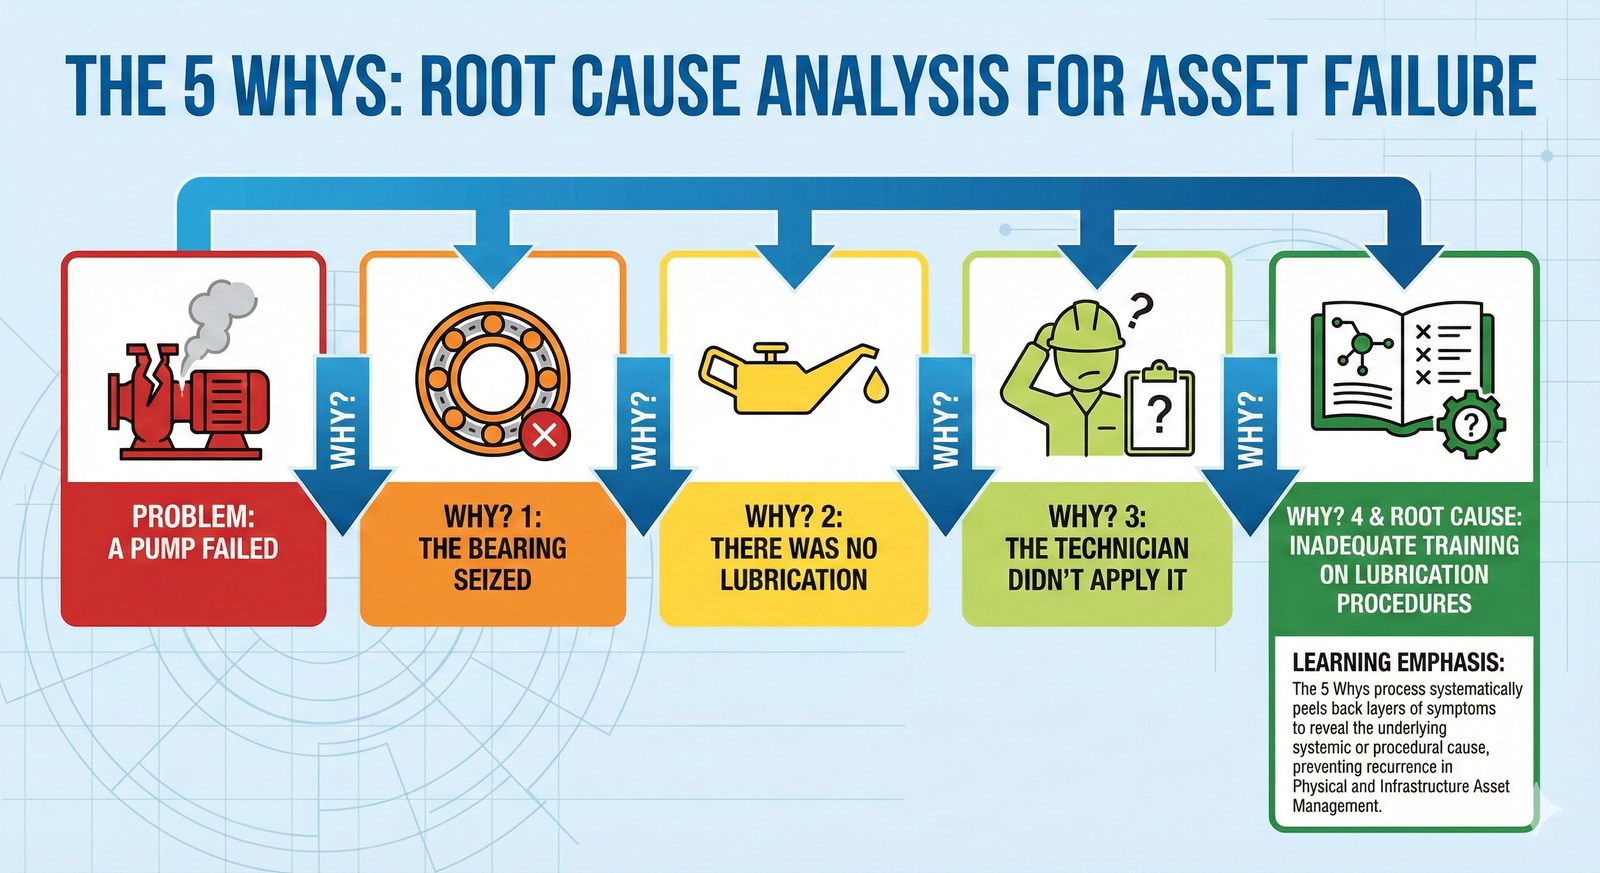
Notice the progression. We went from a broken part (the bearing) to a flawed system (how we prioritize work). The solution is not to just stock more bearings; it's to develop a robust maintenance prioritization system. This is how you create lasting improvements.
The Fishbone (Ishikawa) Diagram
For more complex problems, the 5 Whys might be too linear. A Fishbone diagram, also known as an Ishikawa diagram, helps you brainstorm and categorize potential causes more broadly.
You start with the problem statement as the "head" of the fish. The main "bones" of the skeleton represent categories of potential causes. For asset management, common categories include:
- Manpower (People): Operator error, lack of training, inadequate staffing.
- Method (Process): Incorrect procedures, poor communication, flawed standards.
- Machine (Equipment): Equipment wear, design flaws, improper settings.
- Material: Wrong raw materials, inconsistent quality, poor handling.
- Measurement: Inaccurate sensors, incorrect calibration, bad data.
- Milieu (Environment): Temperature, humidity, contamination.
You and your team then brainstorm potential causes within each category, creating a comprehensive map of all the factors that could be contributing to the problem.
📊 View Diagram: Fishbone Diagram for Pump Failure
Warning: Avoid Blame and Hasty Conclusions
A successful RCA requires a 'blameless' culture. The goal is to find flaws in systems and processes, not to point fingers at individuals. When a person makes a mistake, a good RCA asks why the system allowed that mistake to happen. Was the training inadequate? Was the procedure confusing? Was the person fatigued from overwork? Focusing on the system, not the person, is the only way to build a resilient and continuously improving operation.
Tying It All Together: The Continuous Improvement Cycle
OEE and RCA are not one-off activities; they are two halves of a continuous improvement cycle.
- Measure: You use OEE to consistently measure and monitor the performance of your critical assets. This gives you a data-driven starting point and highlights your biggest losses.
- Analyze: When OEE reveals a significant problem (e.g., a sudden drop in Availability), you initiate an RCA to find the true underlying cause.
- Improve: Based on your RCA findings, you implement a corrective action that addresses the root cause. This might be a change to a maintenance procedure, an update to operator training, or a modification to the equipment itself.
- Control: You standardize the improvement. You update documentation, procedures, and training materials to ensure the fix stays in place and the problem doesn't return.
Then, the cycle begins again. You continue to Measure OEE, which will now (hopefully) show the positive impact of your improvement. This cycle transforms asset management from a reactive, "fire-fighting" discipline into a proactive, data-driven profession focused on creating value.
As we look to the future, this cycle is becoming faster and more intelligent. The Industrial Internet of Things (IIoT) allows for real-time OEE tracking. Machine learning algorithms can now analyze sensor data to predict failures before they happen and even suggest potential root causes, giving asset managers a powerful head start on the analysis process. But even with the most advanced technology, the fundamental thinking process of Measure (OEE) and Analyze (RCA) remains the core skill of an effective asset manager.
Closing
We've covered a lot of ground, moving from the simple green and red lights of a dashboard to a much more nuanced understanding of asset performance. The key takeaway is that true control over your assets comes from a two-step process: quantifying your losses with a holistic metric like OEE, and then systematically investigating the causes of those losses with a structured method like RCA.
This isn't just an academic exercise. The ability to analyze asset performance data to identify trends and implement lasting improvements is a critical competency that separates the best asset managers from the rest. It's the skill that allows you to justify investments, optimize maintenance strategies, and contribute directly to your organization's bottom line. By embracing the cycle of measuring with OEE and analyzing with RCA, you position yourself as a strategic leader who creates value, rather than just a custodian who fixes what's broken.
Learning Outcomes
In this reading, you have developed the skills to move beyond surface-level metrics and truly understand the performance of your physical assets. You are now able to:
- Analyze asset performance data to identify trends and areas for improvement. You can now calculate and interpret Overall Equipment Effectiveness (OEE) to pinpoint losses in Availability, Performance, and Quality.
- Differentiate between symptoms and root causes. You can apply Root Cause Analysis (RCA) techniques like the 5 Whys and Fishbone diagrams to uncover the fundamental issues behind asset failures and performance gaps.
- Understand and apply key industry terminology. You have gained a working knowledge of critical concepts including Key Performance Indicators (KPIs), Asset Performance, Uptime, and Downtime, and how they fit together to form a complete picture of operational health.
Assess Yourself
Test your understanding of the key concepts from this reading.
❓ Knowledge Check
Test your understanding of the key concepts from this section.
Next Steps
Excellent work completing this reading. You've taken a significant step in learning how to make data-driven decisions in asset management. Please navigate back to the course to continue your learning journey.

